SEO

Introduction
Search Engine Optimization (SEO) is the practice of improving a website’s technical setup, content, and authority to boost its visibility in search results. It helps businesses attract organic traffic by aligning website content with user search intent.
The Web Almanac’s SEO chapter focuses on the critical elements and configurations influencing a website’s organic search visibility. The primary goal is to provide actionable insights that empower website owners to enhance their sites’ crawlability, indexability, and overall search engine rankings. By conducting a comprehensive analysis of prevalent SEO factors, we hope that websites can uncover the most impactful strategies and techniques for optimizing a website’s presence in search results.
This chapter combines data from HTTP Archive, Lighthouse, Chrome User Experience Report, and custom metrics to document the state of SEO and its context in the digital landscape.
This year, we analyzed one inner page per site crawled in addition to the home pages, which is all this chapter has historically analyzed. Since home pages are often quite different from inner pages, this has unlocked new insights and allowed us to compare the behaviors of home pages verses inner pages.
Crawlability & indexability
For a page to appear in a search engine results page (SERP), the page must first be crawled and indexed. This process is a critical foundation of SEO.
Search engines may discover pages in several ways, including external links, sitemaps, or by being directly submitted to the search engine using webmaster tools. In 2022, Bing shared that its crawler discovered nearly 70 billion new pages daily. During this year’s antitrust suit against Google, it was revealed that its index is only around 400 billion documents. That means far more pages are crawled than indexed.
This section addresses the state of the web, as it relates to how search engines crawl and index content, as well as the directives and signals SEOs can provide so that crawlers interact and retain versions of their content.
robots.txt
As search engines explore the web, they stop at the robots.txt file, which one can think of as a visitors’ center for each site. The robots.txt file sits at the root of an origin and allows site owners to implement the Robots Exclusion Protocol. It’s designed to signal or instruct bots which URLs a search engine can or cannot crawl.
It is not a hard, technical directive. Rather, it’s up to the bot to honor these instructions. Since the major search engines respect this protocol, it’s relevant for our SEO analysis.
While the robot.txt file has been used since 1994 to control how a site is crawled, it only became formally standardized with the Internet Engineering Task Force in September 2022. The formalization of the RFC 9390 protocol in 2022 occurred after the previous year’s edition of the Web Almanac was published and led to stricter enforcement of technical standards.
For the measurements for this year’s Web Almanac, we ran Lighthouse, an open-source, automated tool for improving the quality of web pages in tandem with our own data collection. These audits showed that 8.43% of desktop pages and 7.40% of mobile pages failed the tool’s check for valid robots.txt files.
robots.txt status codes
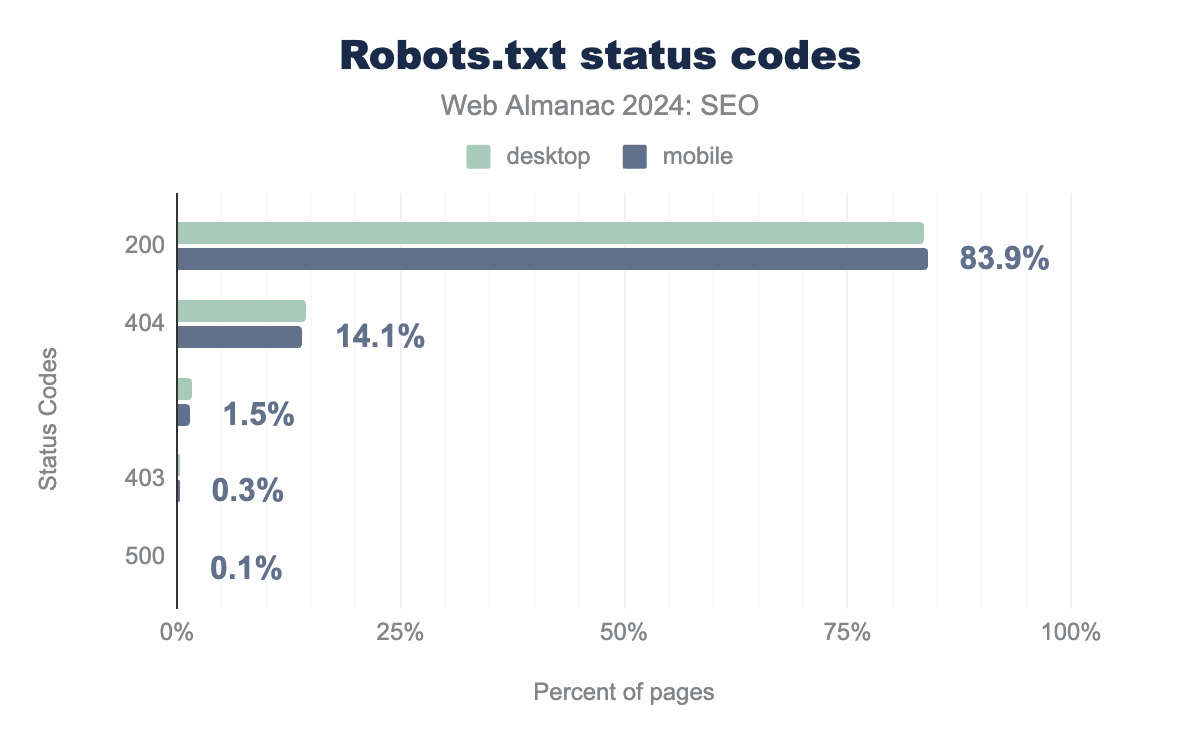
robots.txt file. A total of 83.9% of mobile sites returned a 200 status code, while 14.1% returned a 404 status code. No response was received for 1.5% of mobile requests to the file. Just 0.3% and 0.1% of mobile requests received a forbidden (403) or server error response. Response distribution on desktop behaved similarly with 83.5% returning a 200 status code, while 14.3% returned a 404 response code. No response was received for 1.7% of mobile requests to the file. Just 0.3%, and 0.1% of mobile requests received a forbidden (403) or server error response.robots.txt status codes.
Since 2022, there has been a nominal increase in the percentage of sites whose robots.txt files return a 200 status code. In 2024, 83.9% of robots.txt files for mobile sites returned a 200 status code, while 83.5% of desktop sites returned a 200 status code. That’s up from 2022 when mobile and desktop sites returned 200 status codes of 82.4% and desktop 81.5%, respectively.
This small increase signals that, despite the standard’s relatively recent formalization, its previous three-decade history had already led to wide-scale adoption.
Additionally, the difference between mobile and desktop sites returning a 200 status code has now narrowed to just a 0.4% difference, compared to the 1.1% gap in 2022. While one cannot draw a definitive conclusion for the percentage decrease, one possible explanation can be the greater adoption of mobile responsive design principles versus the previous prevalence of separate mobile sites.
HTTP status codes significantly impact how a robots.txt file functions. When the file returns a 4XX status code, it is assumed there are no crawling restrictions. Awareness of this behavior has continued to increase as we see a continuing trend of fewer 404 responses to robots.txt files.
In 2022, 15.8% of mobile sites’ robots.txt files returned a 404 status code and 16.5% of desktop sites. Now in 2024, it’s down to 14.1% for mobile site visits and 14.3% for desktop. The drops are fairly consistent with the growth of robots.txt returning 200 status codes, suggesting more sites have decided to implement a robots.txt file.
Only 1.7% of mobile and 1.5% of desktop crawls in 2024 received no response. Google interprets these as an error caused by the server.
For 0.1% of both mobile and desktop requests tested, we received an error code in the 5xx range. While these error codes represent a tiny percentage, it’s worth noting that for Google this would mean the search engine would consider the whole site blocked from crawling for 30 days. After 30 days, the search engine would revert to using a previously fetched version of the file. If a prior cached version isn’t available, it is assumed the search engine crawled all of the content hosted on the site.
The nominal error rate suggests that simple text files in most cases—or handled automatically by many popular CMS systems that provide a robots.txt directive—are not a large challenge.
robots.txt size
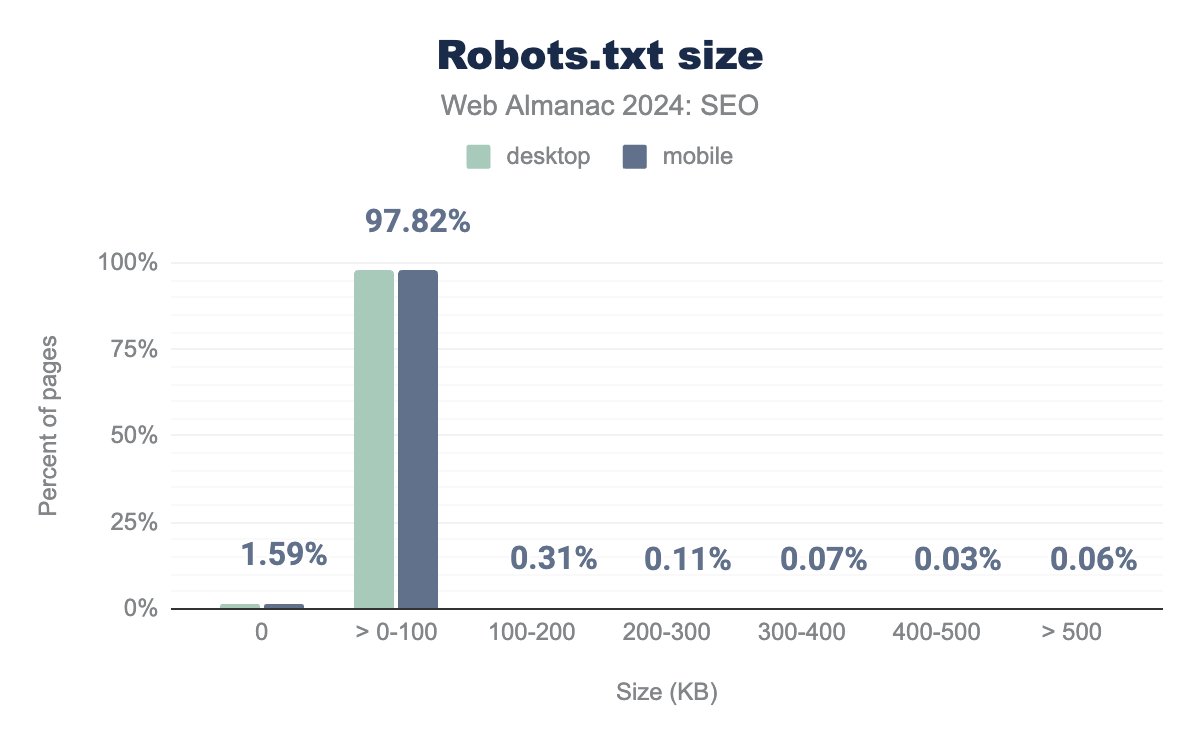
robots.txt sizes in 100 kilobyte increments. 1.66% of desktop and 1.59% of mobile crawls returned a 0 sized robots.txt file. For mobile, 97.82% are in 0-100 KB range, 0.31% in 100-200 KB, 0.11% in 200-300 KB, 0.07% in 300-400 KB, 0.03% in 400-500 KB, and 0.06% are larger than 500 KB. For desktop, 97.80% are in 0-100 KB range, 0.31% in 100-200 KB, 0.10% in 200-300 KB, 0.05% in 300-400 KB, 0.02% in 400-500 KB, and 0.05% are larger than 500 KB.robots.txt size.
The vast majority of robots.txt files—97.82% of mobile crawls and 97.80% of desktop crawls—were no larger than 100KB.
According to RFC 9309 standards, crawlers should limit the size of robots.txt files they look at, and the parsing limit must be at least 500 kiB. A robots.txt file under that size should be fully parsed. Google, for example, enforces the max limit at 500 kiB. Only a tiny number of sites (just 0.06%) had robots.txt files over this limit. Directives found beyond that limit are ignored by the search engine.
Interestingly, 1.59% of mobile crawls and 1.66% of desktop crawls returned a 0-sized robots.txt file. This is likely a configuration issue. Since it is not documented by the RFC 9303 specification or support documentation for popular search engine crawlers, it is unclear how this would be handled. If a site returns an empty response for robots.txt, a sensible approach would be to return a robots.txt file with appropriate rules or, if one does not wish to restrict crawling, return a 404 status code for the URL.
robots.txt user agent usage
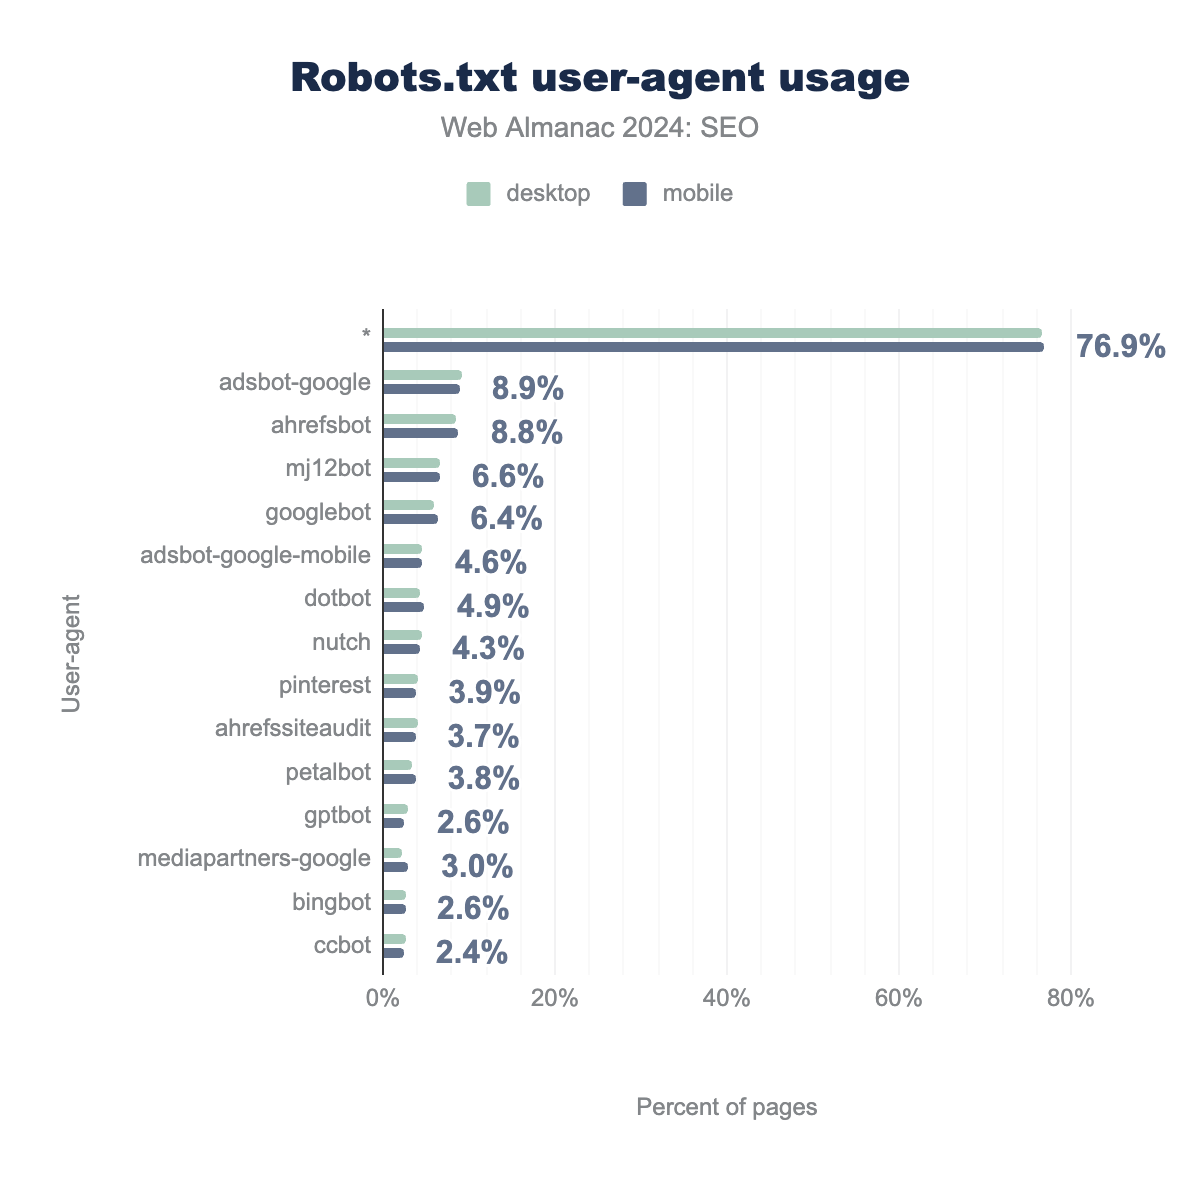
user-agent targets in robots.txt files. For desktop * is 76.6%, AdsBot-Google is 9.1%, AhrefsBot is 8.6%, MJ12Bot is 6.7%, Googlebot is 5.9%, AdsBot-Google-Mobile is 4.6%, Dotbot is 4.4%, Nutch is 4.5%, Pinterestbot is 4.1%, AhrefsSiteAudit is 4.0%, PetalBot is 3.4%, GPTBot is 2.9%, Mediapartners-Google is 2.3%, Bingbot is 2.6%, and lastly the CCBot is 2.7%. Mobile is consistent with desktop at 76.9%, 8.9%, 8.8%, 6.6%, 6.4%, 4.6%, 4.9%, 4.3%, 3.9%, 3.7%, 3.8%, 2.6%, 3.0%, 2.6%, and 2.4%, respectively.robots.txt user agent usage
The * user agent
A full 76.9% of robots.txt files encountered by the mobile crawl and 76.6% of those found in the desktop crawl specify rules for the catch-all user agent of *. This represents a small uptick over the data from 2022 in which it was 74.9% for desktop and 76.1% for mobile crawls. A possible explanation could be the slight overall increase in robots.txt availability.
The * user agent denotes the rules a crawler should follow unless there’s another set of rules that specifically target the crawler’s user-agent. There are notable exceptions that don’t respect the * user agent, including Google’s Adsbot crawler. Other crawlers will try another common user-agent before falling back to *, such as Apple’s Applebot, which uses Googlebot’s rules if they are specified and Applebot if not specified. We recommend checking the support documentation for any crawlers you are targeting to ensure that behavior is as expected when relying on fallback.
Bingbot
Much like in 2022, Bingbot again was not in the top 10 most specified user-agents. Only 2.7% of mobile and 2.6% of desktop robots.txt files specified that user-agent, relegating it down to 14th place.
SEO tools
The data shows there has been an increase in sites specifying rules for the popular SEO tools. AhrefsBot, for instance, has now been detected in 8.8% of mobile crawls, up from 5.3% in 2022. It has overtaken Majestic’s MJ12Bot, which itself increased to 6.6% from 6.0% in 2022 and had previously been the second most popular specifically targeted user-agent.
AI crawlers
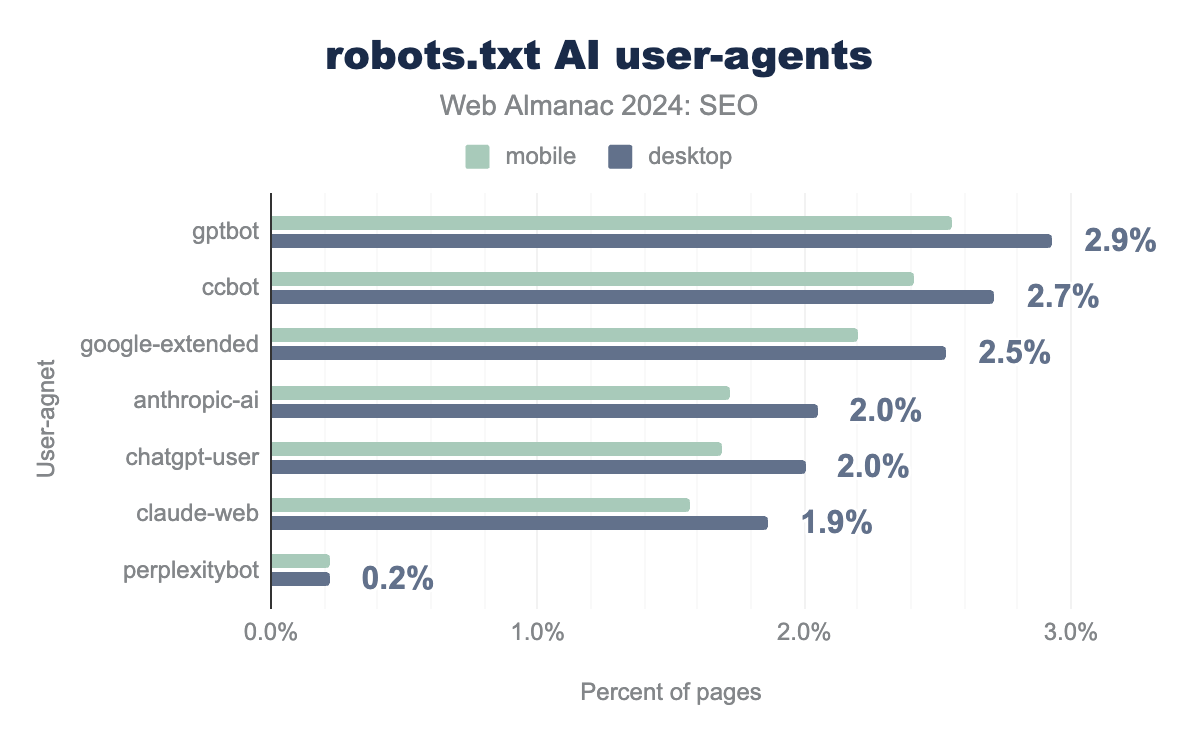
robots.txt files. For desktop, GPTBot is 2.9%, CCBot is 2.7%, Google-Extended is 2.5%, Anthropic-Ai is 2.1%, ChatGPT-User is 2.0%, Claude-Web is 1.9%, and PerplexityBot is 0.2%. The numbers for mobile are slightly slower than desktop at 2.6%, 2.4%, 2.2%,1.7%, 1.7%, 1.6%, and 0.2%, respectively.robots.txt AI user-agent usage.
Over the past two years, large language models (LLMs) and other generative systems have gained traction in both awareness and usage. It appears people are increasingly specifying rules for the crawlers they use in order to gather data for training and other purposes.
Of these, GPTBot is the most commonly specified and found in 2.7% of mobile crawls. The next most common is CCBot, which is Common Crawl’s agent. While CCBot isn’t related only to AI, a number of popular vendors use or have used data gathered from this crawler to train their models.
In summary:
- The formalization of the
robots.txtprotocol in RFC 9309 has led to better adherence to technical standards. - Analysis shows an increase in successful
robots.txtresponses and a decrease in errors, indicating improved implementation. - Most
robots.txtfiles are within the recommended size limit. - The
*user-agentremains dominant, but AI crawlers likeGPTBotare on the rise. - These insights are valuable for understanding the current state of
robots.txtusage and its implications for SEO.
Robots directives
A robots directive is a granular, page-specific approach to controlling how an individual HTML page should be indexed and served. Robots directives are similar to, but distinct from, robots.txt files since the former affect indexing and serving while robots.txt affects crawling. In order for directives to be followed, the crawler must be allowed to access the page. Directives on pages that are disallowed in a robots.txt file may not be read and followed.
Robots directive implementation
Robots directives tags are critical for curating which pages are available to return in search results and how they should be displayed. Robots directives may be implemented in two ways:
- Placing a robots meta tag in the
<head>of a page (for example,<meta name="robots" content="noindex">). - Placing the X-Robots-Tag HTTP header in the HTTP header response.
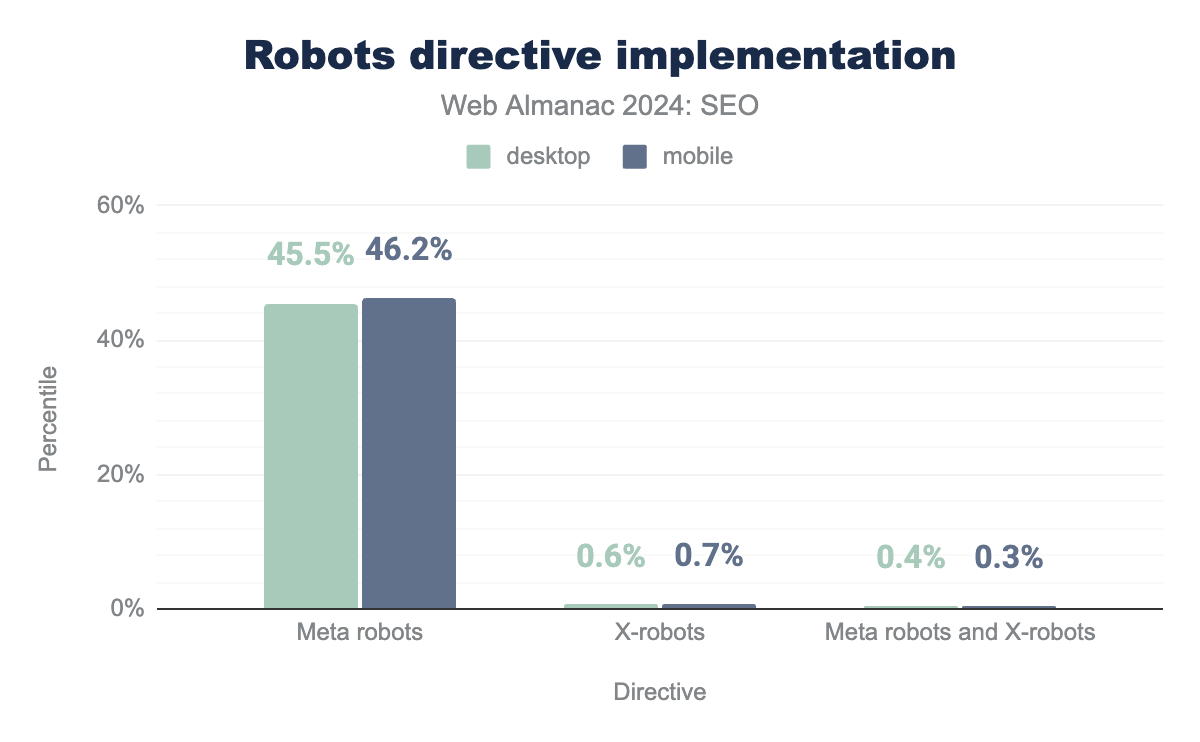
Either implementation method is valid and can be used in tandem. The meta tag implementation is the most widely adopted, representing 45.5% of desktop and 46.2% of mobile pages. The X-robots HTTP header is applied to fewer than 1% of pages. A small number of sites used both tags in tandem. They represented 0.4% of desktop pages and 0.3% of mobile pages.
In 2024:
- 0.4% of desktop and 0.3% of mobile pages saw the directives’ values changed by rendering.
- Inner pages were more likely to have robots directives. And 48% of inner pages contained a meta robots tag compared to 43.9% of home pages.
- Rendering was more likely to change the robots directive of a home page (0.4%) than that of a inner page (0.3%).
Robots directive rules
In 2024, there were 24 valid values—known as rules—that could be asserted in a directive to control the indexing and serving of a snippet. Multiple rules can be combined via separate meta tags or combined in a comma separated-list for both meta tags and X-robots HTTP headers.
For our study of directive rules, we relied on the rendered HTML.
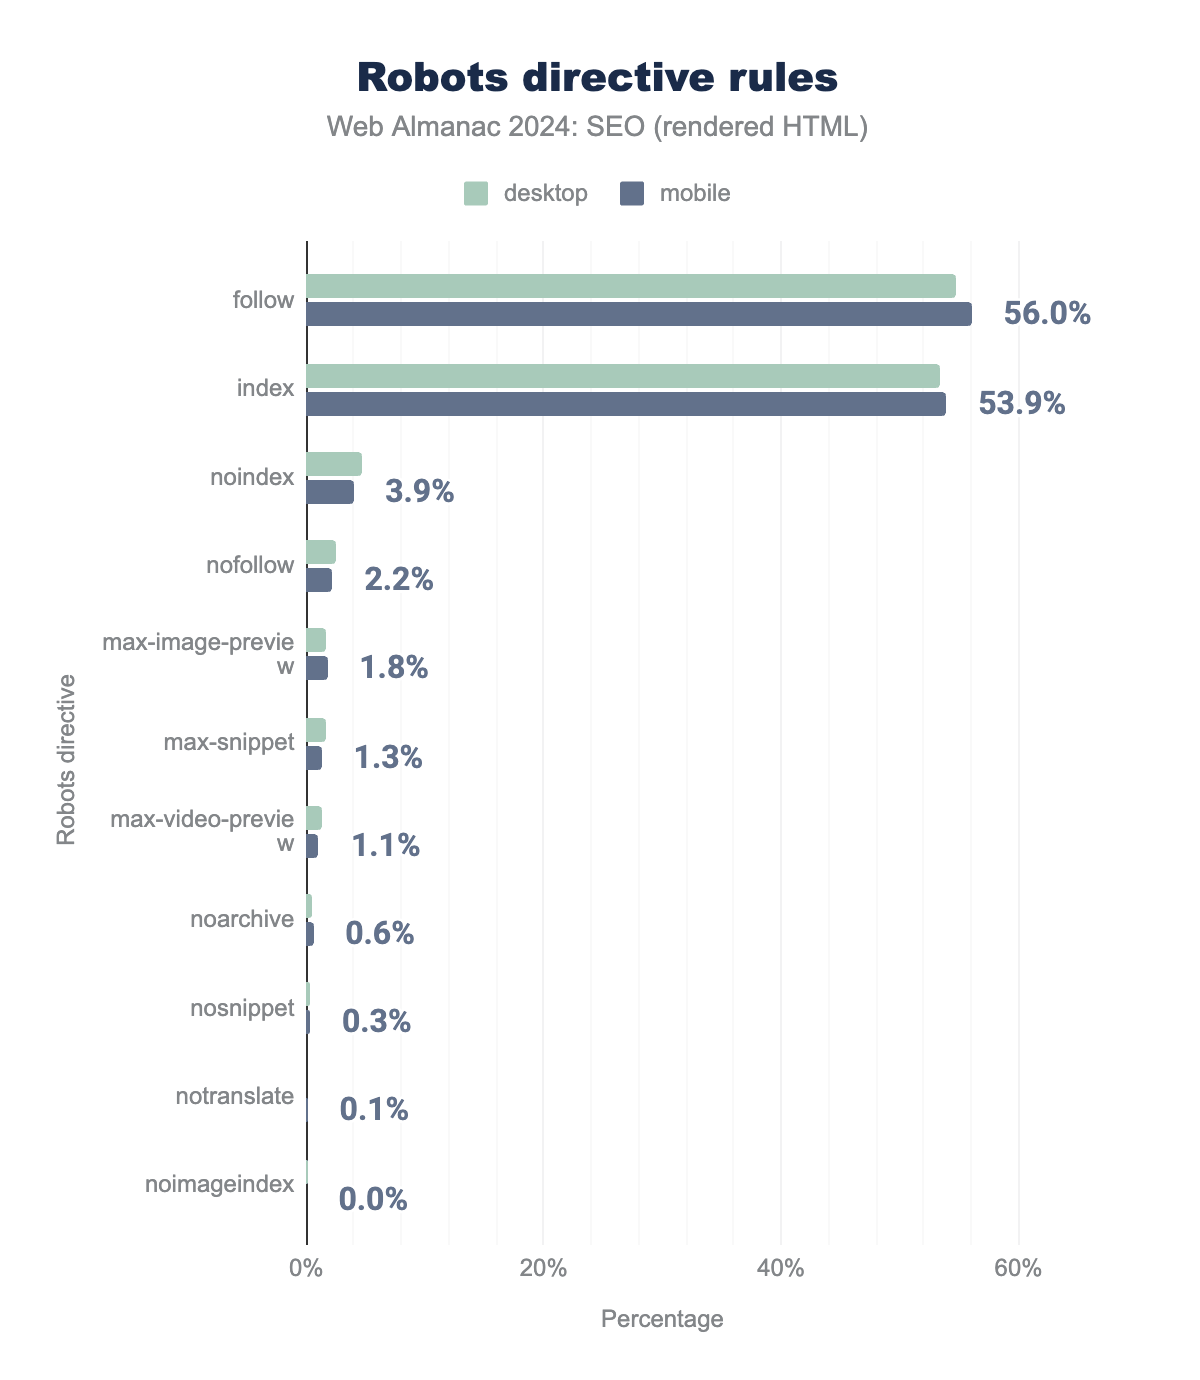
follow, 53.4% used index, 4.7% used nonindex, 2.5% used nofollow, 1.6% used max-image-preview, 1.6% used max-snippet, 1.2% used max-video-preview, 0.5% used noarchive, 0.2% used nosnippet, 0.01% used notranslate, and 0.09% used noimageindex. Mobile rates were similar at 56.0%, 53.9%, 3.9%, 2.2%, 1.8%, 1.3%, 1.1%, 0.6%, 0.3%, 0.10%, and 0.01% respectively.
The most prominent rules in 2024 were follow (54.7% desktop; 56.0% mobile), index (53.4% desktop; 53.9% mobile), noindex (4.7% desktop; 3.9% mobile), and nofollow (2.5% desktop; 2.2% mobile). This is noteworthy since neither “index” nor “follow” directives have any function and are ignored by Googlebot. Google’s documentation on robots tags advises that “The default values are index, follow and don’t need to be specified.”
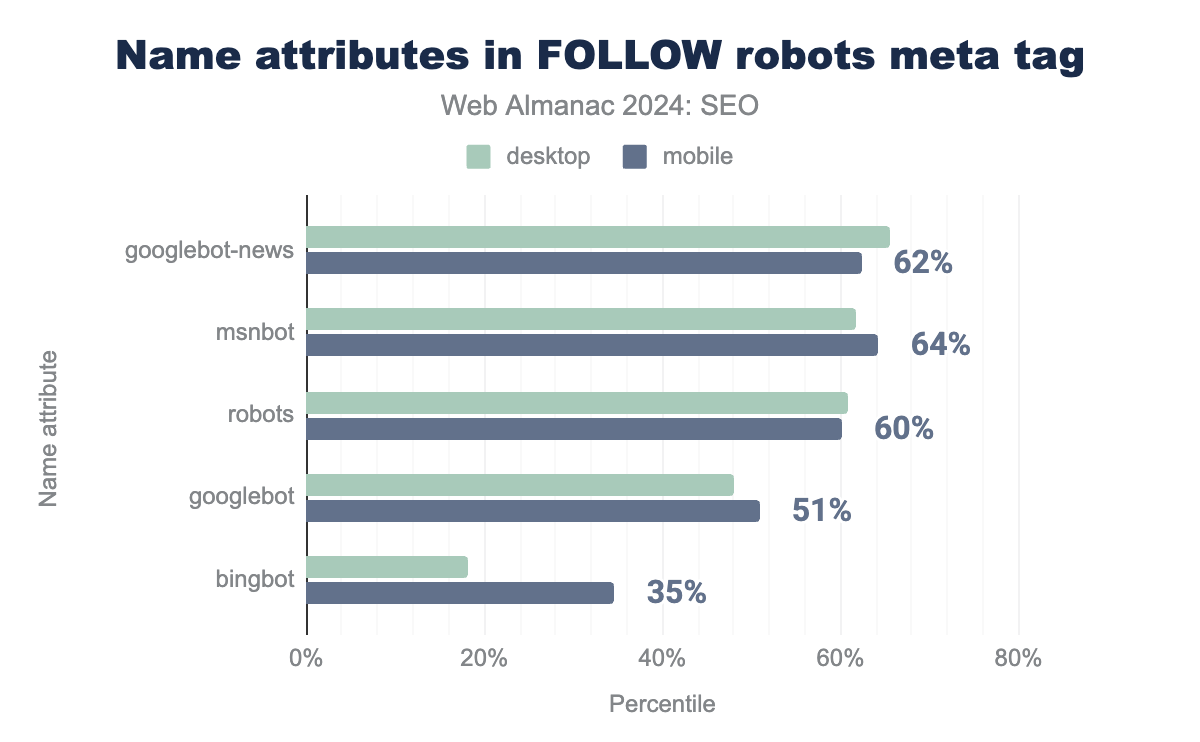
The name value of the robots meta tag specifies to which crawler(s) the rule applies. For example, meta name="robots" applies to all bots whereas meta name="googlebot" applies to only to Google. To analyze the application of name attributes, we looked at rates where values were stated for the follow tag since it is the most prevalent robots meta rule.
Googlebot-News on 62%, MSNBot on 64%, robots on 60%, Googlebot on 51%, and Bingbot on 35% of applicable pages. Desktop was similar at 66%, 62%, 61%, 48%, and 18% respectively.follow robots meta tag.
The five most named crawlers in robots directives were the generic robots value, Googlebot, Googlebot-News, MSNBot, and Bingbot. The name attributes used in the follow robots meta tag show that sites with the tags are apt to tailor their rules to specific bots. While there was generally a slight variance by device, there was a large difference for Bingbot which saw significantly more follow directives on mobile pages (35%) compared to desktop (18%).
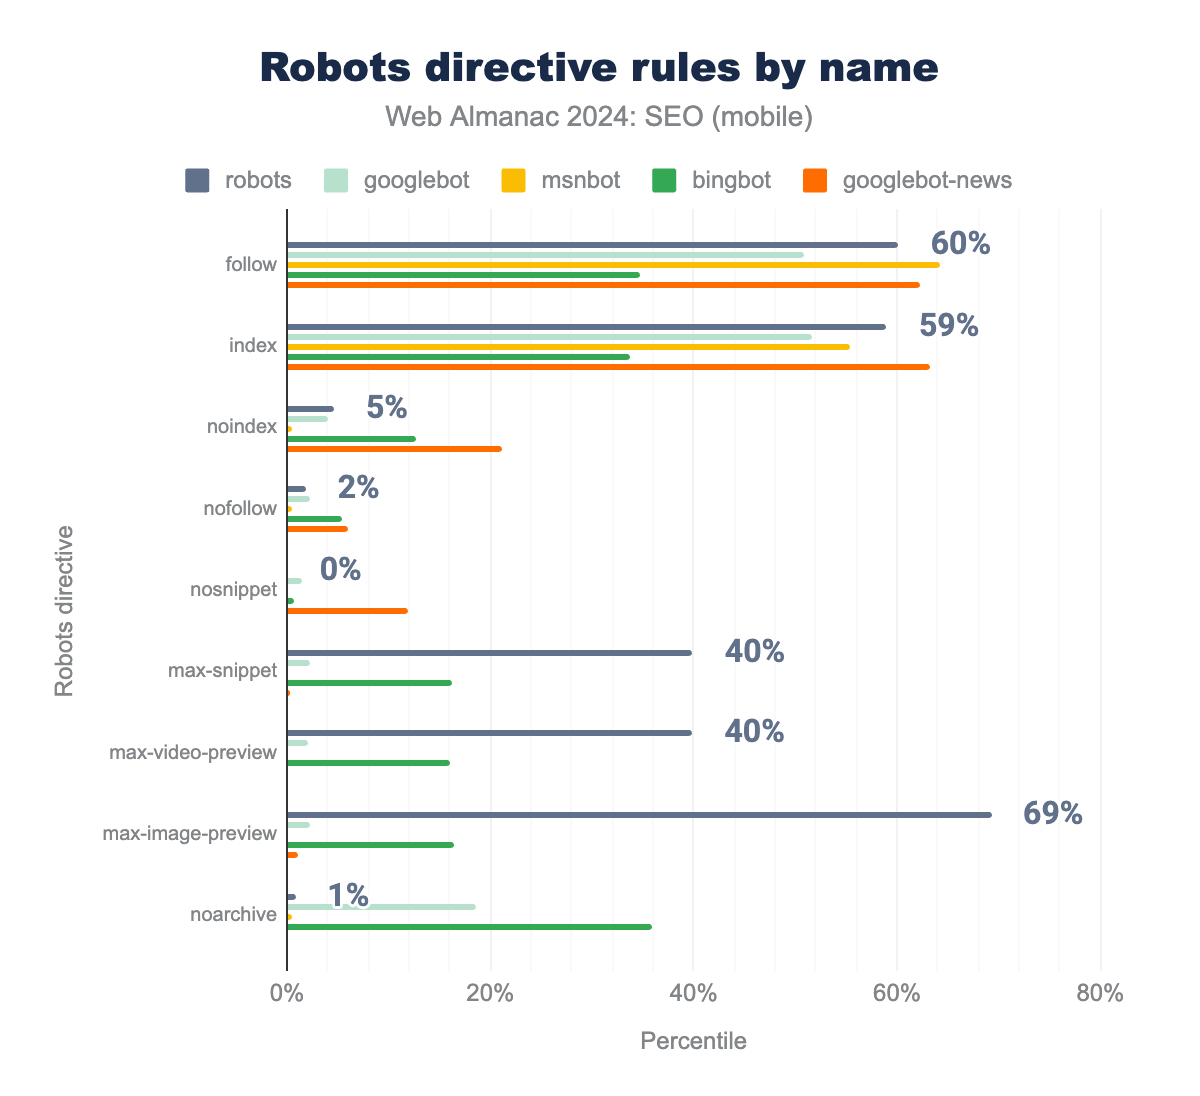
follow: 64%, 62%, , 60%, 51%, and 35%.index: 55%, 63%, 59%, 52% 34%. noindex: 1%, 21%, 5%, 4%, and 13%. nofollow: 1%, 6%, 2%, 2%, and 5%. nosnippet: 0%, 12%, 0%, 1%, and 1%. max-snippet: 0%, 0%, 40%, 2%, and 16%. max-video-preview: 0%, 0%, 40%, 2%, and 16%. max-image-preview: 0%, 1%, 69%, 2%, and 17%. noarchive: 0%, 0%, 1%, 19%, and 36%.When robots directive rules are viewed by their name attributes, we can see varied application rates. This implies that SEOs are adopting directives by specific bot names to curate indexing and serving for individual search engines.
Noteworthy takeaways from our analysis of the rules by bot name include:
- The
noarchiverule was applied overwhelmingly toBingbotat 36%. This is likely due to the tag’s ability to keep content out of Bing chat answers. max-snippet,max-video-preview, andmax-image-previewrules are widely implemented for all robots at the rate of 40%, 40%, and 69%, respectively.Googlebot-Newswas the most named forindex(63%) andnosnippet(12%)MSNBotwas the least likely to be given anoindexdirective (1%). In comparison, the most likely wasGooglebot-Newsat 21%.- 0.01% of sites provided a
noindexrule, using the invalid crawler name: Google. Google has two valid crawler names for recognized robotsmetatags:GooglebotandGooglebot-News.
IndexIfEmbedded tag
In January 2022, Google introduced a new robots tag, indexifembedded. The tag is placed in the HTTP header and offers indexing control for resources used to build a page. A common use case for this tag is for controlling indexation when content is in an iframe on a page, even when a noindex tag has been applied.
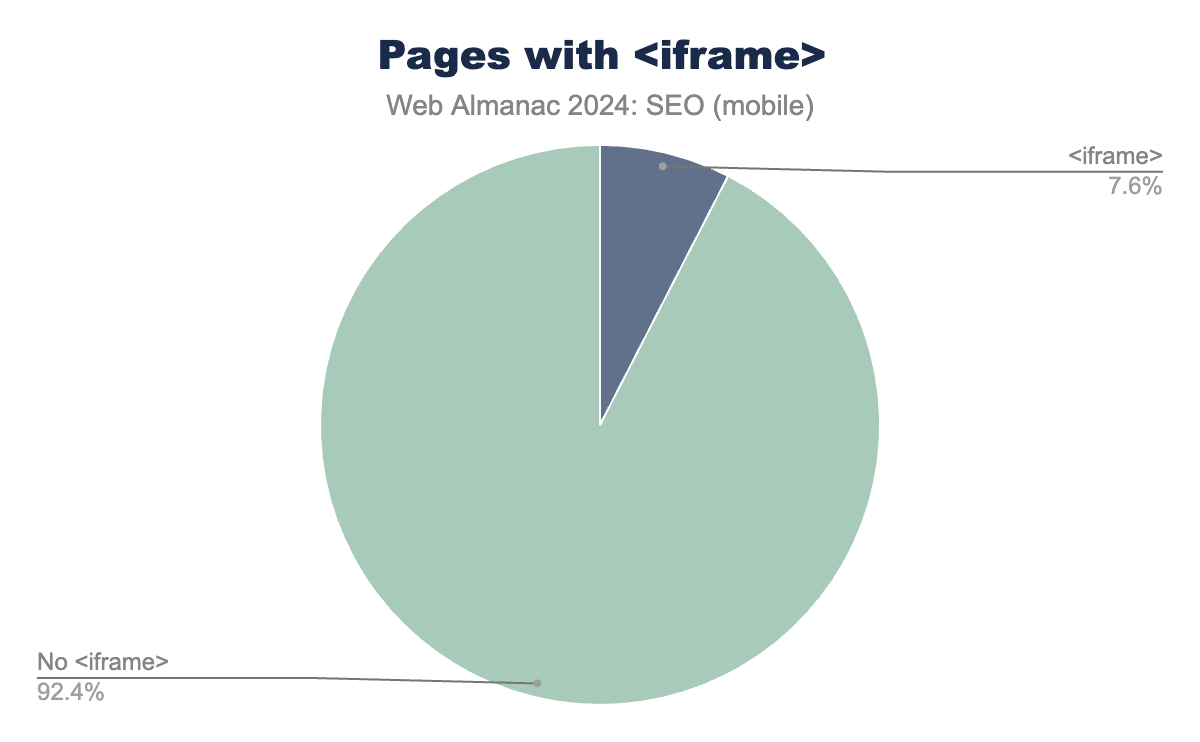
The presence of an <iframe> provides a baseline for cases where the indexifembedded robots directive might be applicable. In 2024, 7.6% of mobile pages contained an <iframe> element. This is a noteworthy increase of 85% from 2022’s rate of 4.1%.
<iframe> within the analyzed content, while 92.4% did not use an <iframe>.<iframe>.
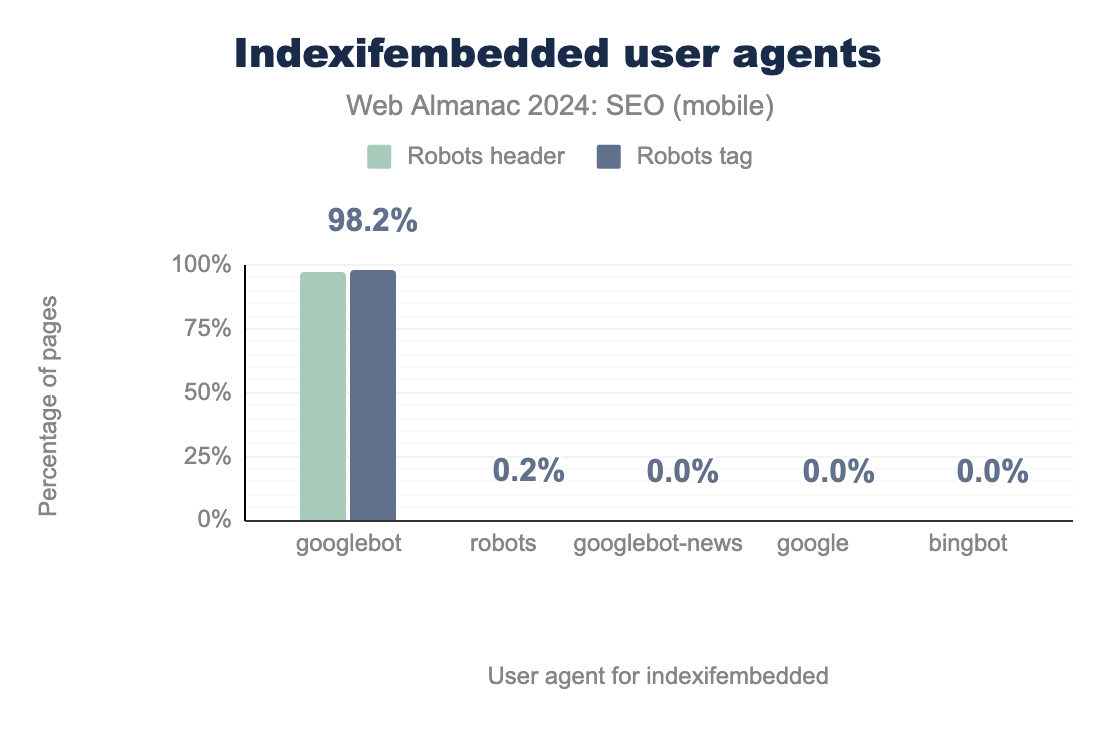
Nearly all sites employing iframes also use the indexifembedded directive. When iframe headers from mobile pages were examined, 99.9% used noindex directives and 97.8% used indexifembedded.
Googlebot user agent.The generic robots user agent was stated 0.2%. The other user agents (including Googlebot-News and Bingbot) show 0% usage.As we saw in 2022, indexifembedded directives continued to be almost exclusively used for Googlebot. While robots header use decreased slightly to 97.2% in 2024 from 98.3% in 2022, adoption of the robots tag increased significantly to 98.2% in 2024 from 66.3% in 2022.
Invalid <head> elements
Search engine crawlers follow HTML standard and when they encounter an invalid element in the <head>, it ends the <head> and assumes the <body> has started. This can prevent important metadata from being discovered or incomplete renderings.
The impact of a prematurely closed <head> is often difficult to catch since the problematic tag’s position may change on every page load. Broken <head> tags are frequently identified by reports on missing elements such as canonical, hreflang, and title tags.
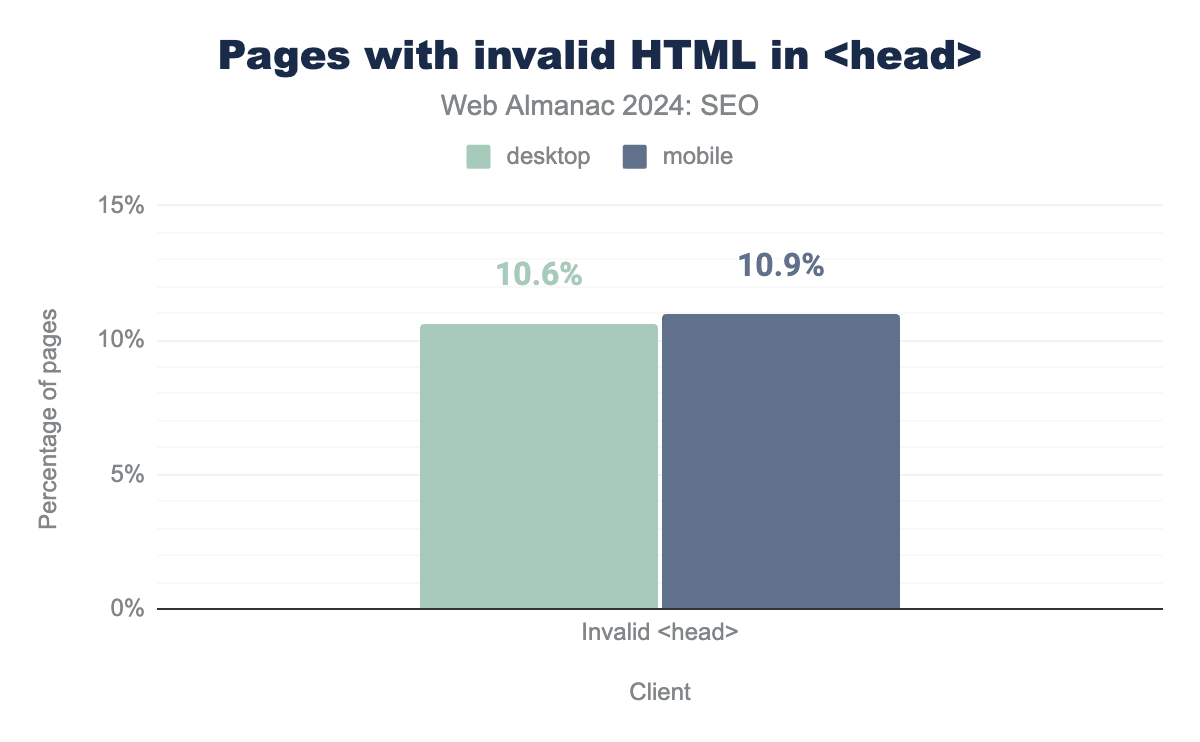
<head> of the page.<head>.
In 2024, 10.9% of mobile pages had <head> breaking invalid HTML elements. That represented a 12% decrease from 2022’s rate of 12.6%. Meanwhile, desktop pages with invalid HTML in the <head> decreased from 12.7% in 2022 to 10.6% in 2024.
<head>
There are eight valid elements that may be used in the <head> according to Google Search documentation. These are:
titlemetalinkscriptstylebasenoscripttemplate
No element other than the aforementioned is permitted by the HTML standard in the <head> element. Documentation further states, “Once Google detects one of these invalid elements, it assumes the end of the <head> element and stops reading any further elements in the <head> element.”
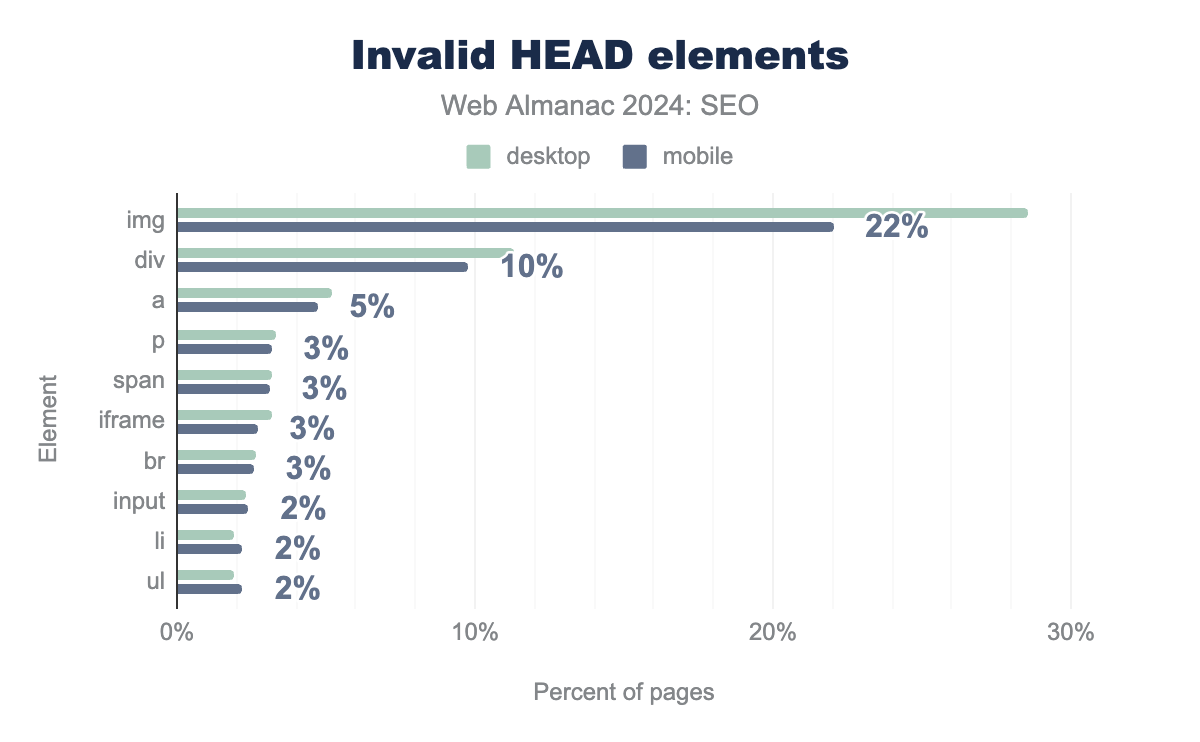
<head>. On Desktop <img> is used in the head on 29% of pages, <div> on 11%, <a> on 5%, <p> on 3%, <span> on 3%, <iframe> on 3%, <br> on 3%, <input> on 2%, <li> on 2%, and finally <ul> 2%. Mobile is very similar at 22%, 10%, 5%, 3%, 3%, 3%, 3%, 2%, 2%, and 2% respectively.<head> elements.
The most prevalent <head> breaking tag was the <img> element, affecting 29% of desktop and 22% of mobile instances of the issue. Comparatively, the 2022 chapter found <img> tags misapplied on 10% of mobile pages and 10% of desktop pages. The likely difference comes from deprecated implementation methods for third-party tools.
Misapplied <div> tags also substantially increased from 2022. In 2024, 11% of desktop and 10% of mobile pages had the <div> element in the <head>. That’s more than a three times increase from 2022 when the invalid <head> occurred on 4% of desktop pages and 4% of mobile pages.
Canonicalization
Canonicalization is the process of identifying the “preferred” version of a document when multiple versions are available. This is often necessary when a website has the same content accessible through different URLs, such as with HTTP/HTTPS, www/non-www, trailing slashes, query parameters, and other variations.
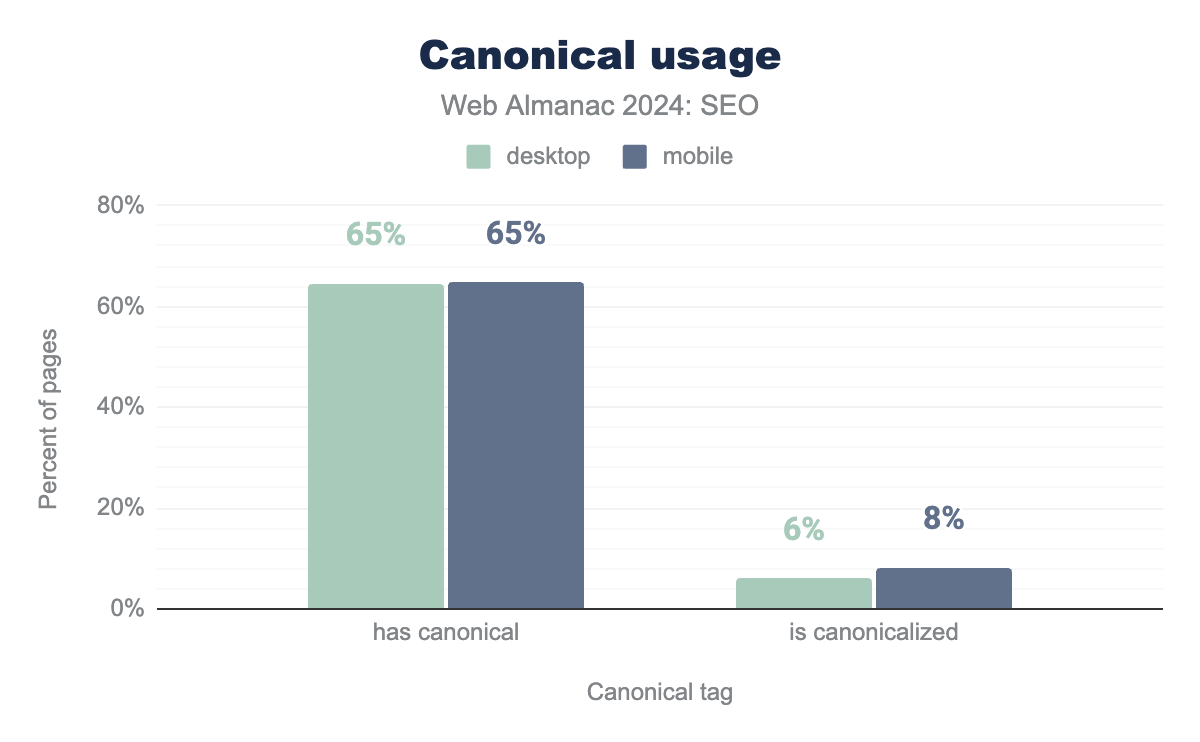
canonical tags are signals for search engines about which version of the content to return in search results. While they are not directives like meta robots, they do serve as “strong hints.” They benefit SEO by mitigating duplicate content, consolidating signals such as links to page variations, and allowing webmasters to better manage content syndication.
canonical tag usage was up slightly in 2024. In 2022, 61% of mobile and 59% of desktop pages used canonical tags. In 2024, it was up to 65% of mobile and 69% of desktop pages.
canonical set or are canonicalized. canonical adoption is at 65% on desktop and 65% on mobile, and is canonicalized at 6% on desktop and 8% on mobile.Canonical implementation
canonical tags have three implementation methods:
- In the HTTP headers (via the Link HTTP header.
- In the HTML’s
<head>section of a pag. - Via sitemap
HTML <head> tag implementation can occur in two specific points:
- As a link in the raw HTML received in response from the serve.
- As a link In the rendered HTML after scripts have been executed
Each implementation has its own nuance. HTTP headers can be used on non-HTML documents like PDFs, whereas rel="canonical" cannot. Additionally, canonicals via sitemap may be easier to maintain but are a weaker signal than on-page declarations.
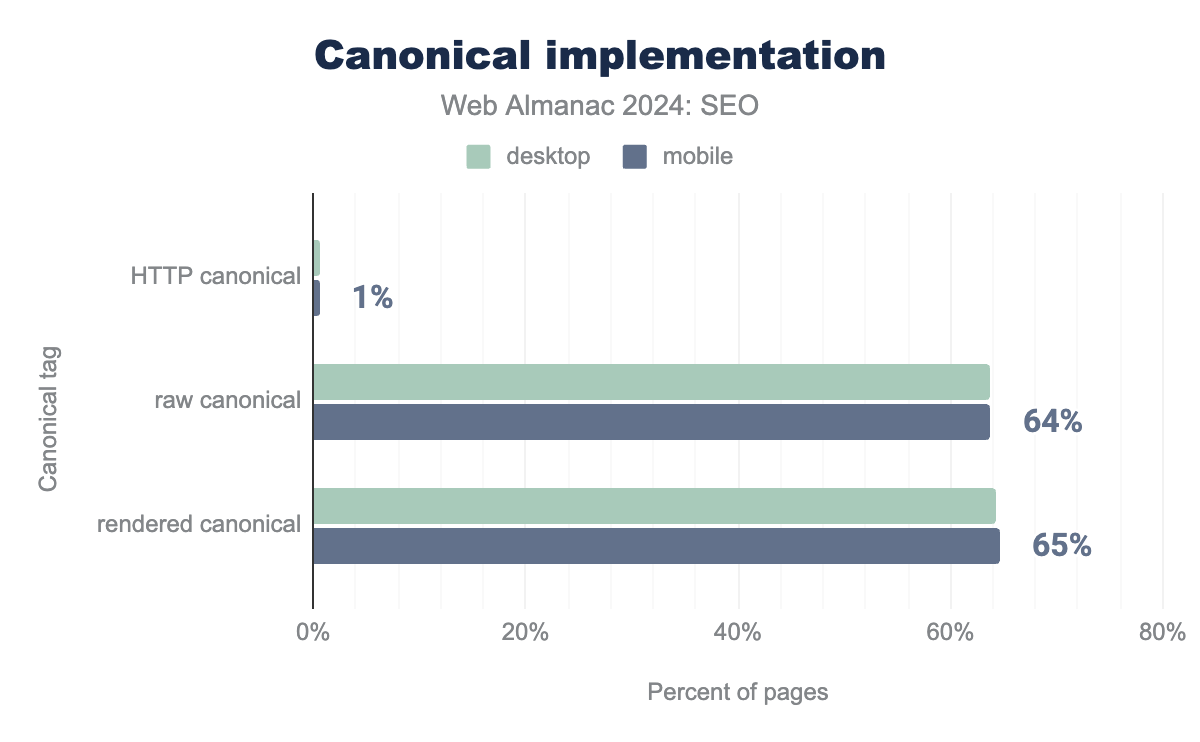
Analyzing canonical sitemap implementation requires determining the associated duplicate for any declared canonical values. As excited researchers, we adjusted our analysis accordingly to report on the three places where search crawlers would encounter canonical tags. A canonical could first be found in the HTTP header, next in the raw HTML, and finally in the rendered DOM.
Only 1% of mobile pages currently use the HTTP header, down from 1% in 2022. This is likely due to its implementation requiring server configuration. Instead, 65% of mobile pages use a rel="canonical" nested in the <head>.
Most sites using <head> canonical tags implement them in the raw and rendered HTML. Fewer than 1% of mobile and desktop pages had a canonical element present in the raw HTML (but not in the rendered HTML).
Rendered canonical implementation was up from 60% of mobile in 2022 to 65% of mobile usage in 2024. Desktop usage increased from 58% in 2022 to 65% in 2024, making adoption rates near identical between device types.
Canonical conflicts
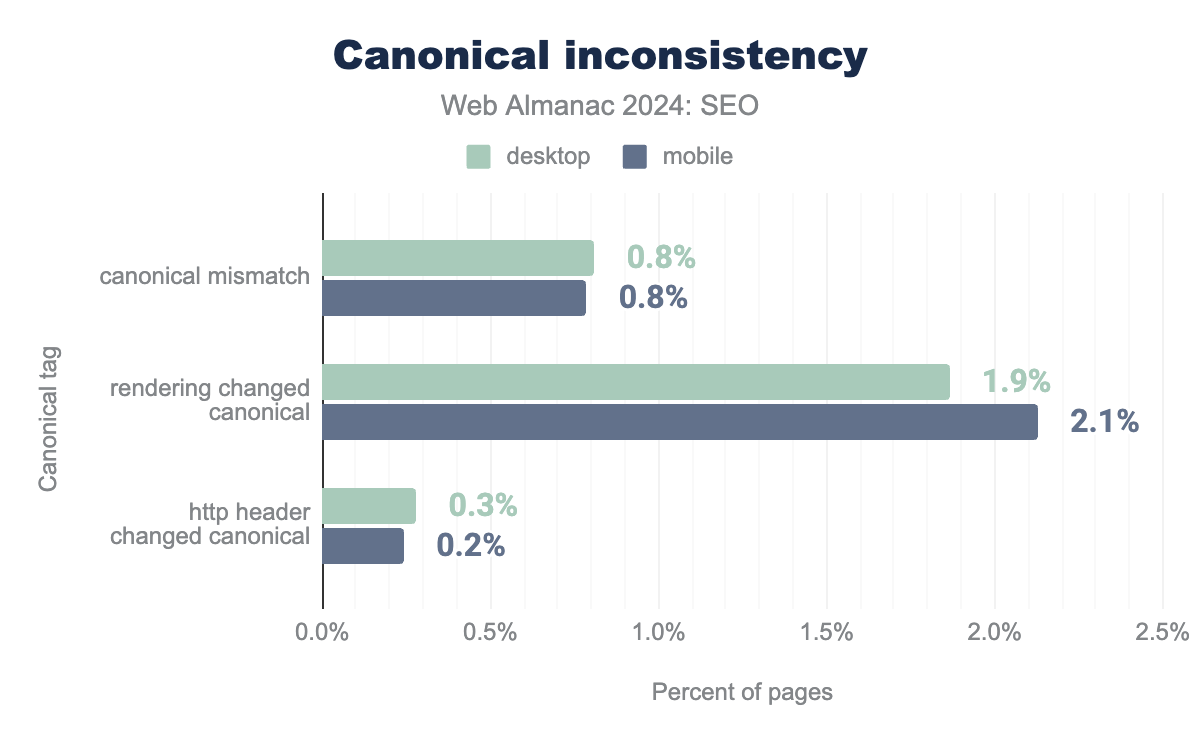
There are three opportunities for a page to send a canonical, but sending the signal more than once can result in conflicts. For example, if the canonical URL in the HTTP doesn’t match that in the rendered HTML, then the search engine is signaled that the primary version of content exists in multiple places. This undermines the purpose of the element and causes undefined behavior, according to Google. In 2022, this affected 0.4% of pages. Now, the rate has doubled to 0.8% in 2024.
Similarly, rendering can change the canonical found in the raw HTML. This is more prevalent, and it affects 2.1% of mobile pages. HTTP header canonical tags were less likely to be changed in the rendering process. In 2024, only 0.6% of desktop pages and 0.5% of mobile pages saw a canonical value passed in the HTTP header and then changed.
Of pages where a canonical element was detected, 98% passed the Lighthouse audit for valid rel=canonical.
Mismatched canonical values occurred on 0.8% of mobile and desktop pages. Rendering was more likely to change canonical elements on desktop (1.9%) than on mobile (2.1%). HTTP canonical elements, while seldom used, were changed during the rendering process in 0.3% of desktop pages and 0.2% of mobile pages.
Page experience
Simply, users want good experiences on the web. In 2020, Google introduced page experience to its algorithm. This section looks at how page experience has evolved.
HTTPS
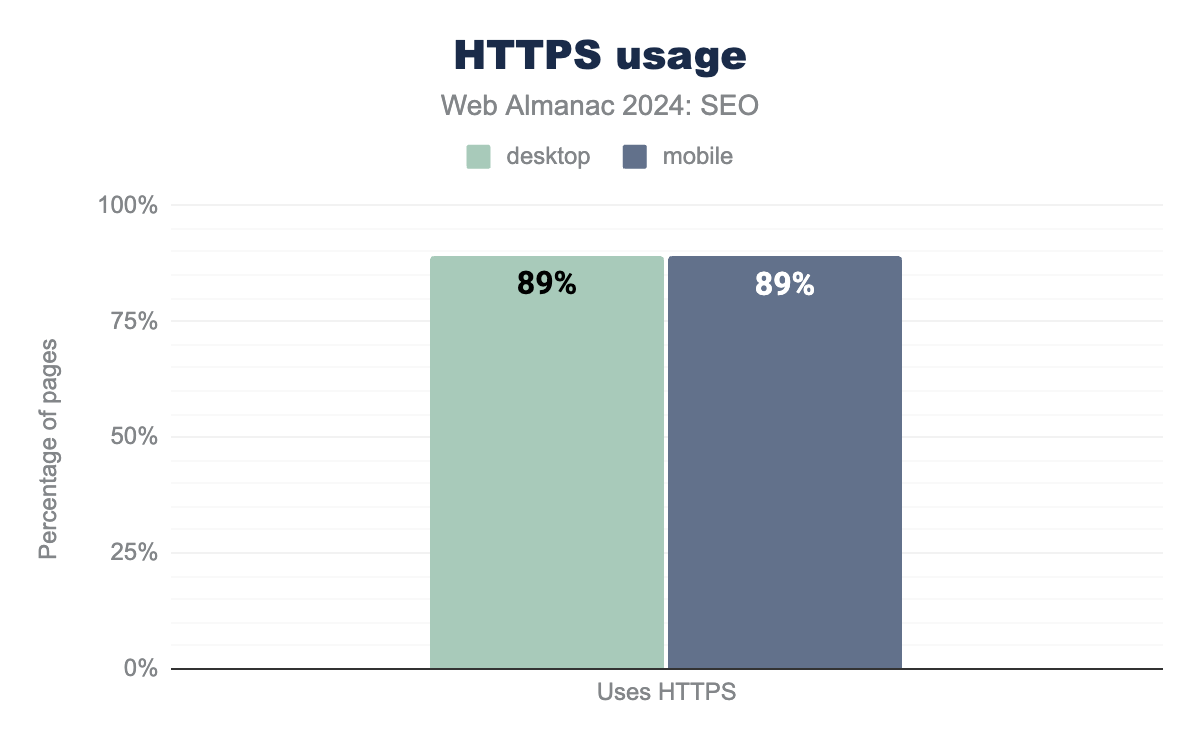
Google adopted HTTP as a ranking signal in 2014. HTTPS uses a protocol to encrypt communications. It’s established via the presence of a secure certificate issued by a third party at the time of crawl. Adoption has continued to steadily increase over the years. In 2024, 89% of desktop pages and 88.9% of mobile pages used the HTTPS protocol.
For a more in-depth analysis of this topic, see the Security chapter.
Mobile-friendliness
Search engines and websites have a common goal—meeting users where they are. There are 6.61 billion mobile users worldwide, and 69.4% of the world’s total population uses a mobile device.
Google search has considered mobile-friendliness to be a requirement since 2015. The search engine completed its seven-year migration to a mobile-first index in 2023.
Mobile-friendliness can be determined by the presence of two tags:
-
Viewportmeta tag, which is commonly used in responsive desig. -
Vary: User-Agentheader, which is used in dynamic serving and is based on the request header
Viewport meta tag
A <meta name="viewport"> optimizes for mobile screen sizes and can reduce delays to user input.
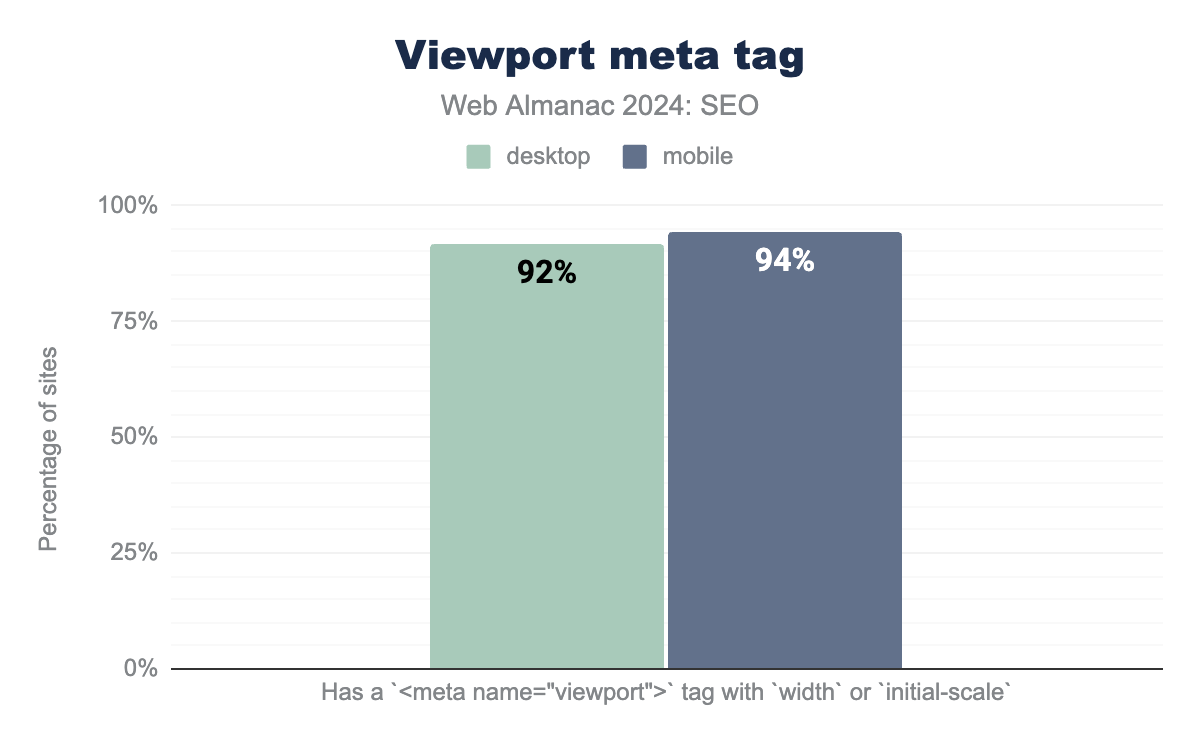
Usage of the Viewport meta tag continued to increase in 2024 with 92% of desktop pages and 94% of mobile pages passing the Lighthouse check for a ’viewport tag’ with width or initial-scale set. This was up by 1% from 2022’s adoption rates when 91% of mobile pages used the tag.
<meta name="viewport"> tag with width or initial-scale set. In 2024, 92% of applicable desktop pages and 94% of mobile pages passed this Lighthouse audit.Viewport meta tag use on mobile increased to 94% in 2024 from 92% in 2022.
Vary header usage
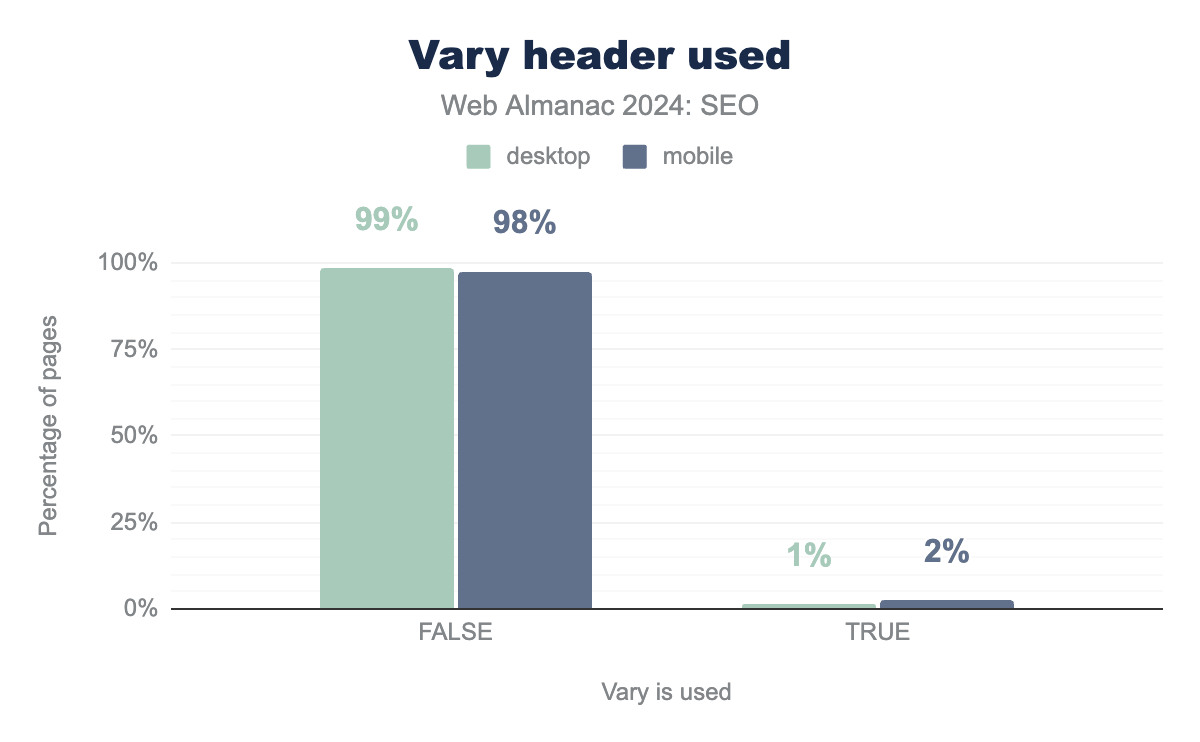
The vary HTTP response header enables different content to be served based on the requesting user agent. Also known as dynamic serving, this header allows the page to return content best suited for the requesting device.
Vary header usage fell significantly in 2024. The header appeared on 12% of desktop and 13% of mobile pages in 2022. It is now down to 1% of desktop and 2% of mobile. The decrease is likely due to Google specifically stating how dynamic rendering is not a sustainable long-term solution for problems related to JavaScript-generated content. Instead, the search engine recommends single solution rendering strategies such as server-side rendering, static rendering, or hydration as solutions.
Legible font sizes
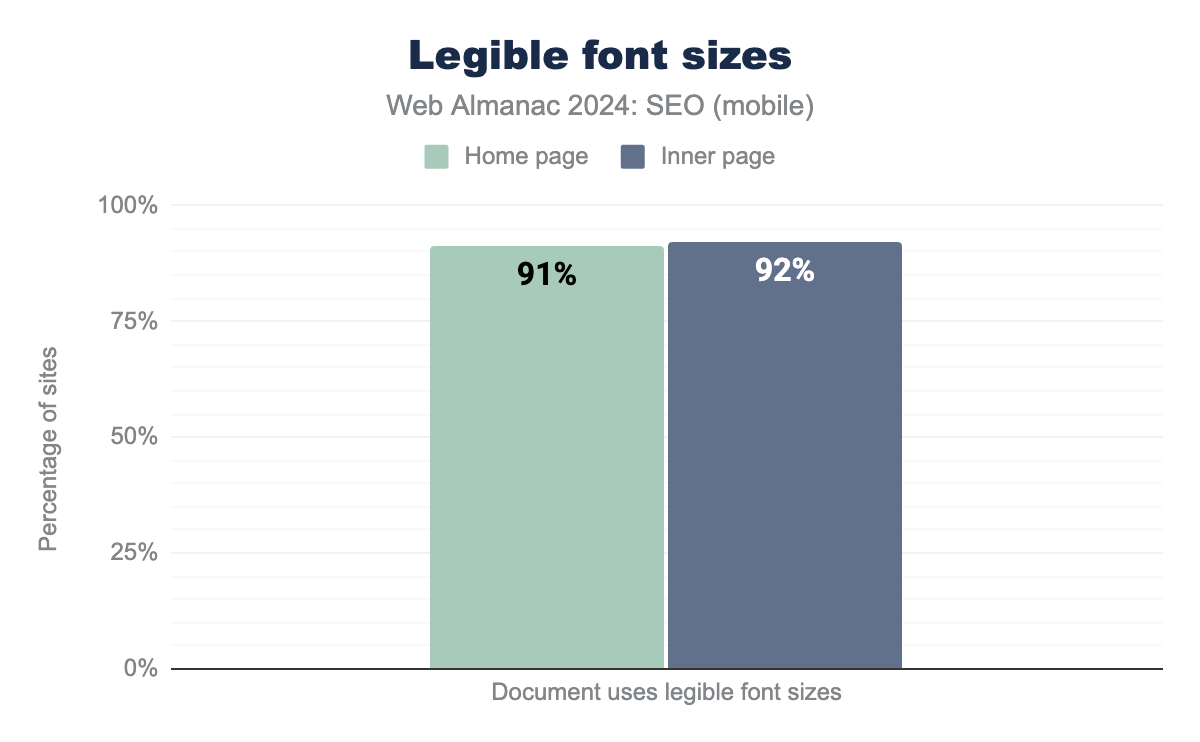
One of the basics of a good mobile experience is being able to easily read the on-page content. Font sizes under 12 pixels require mobile visitors to “pinch to zoom” when reading content. This is considered too small to be legible.
Lighthouse has a legible font size audit that is run as part of with the HTTP Archive crawl. The audit checks for pages that had 60% or more of its content using fonts greater than 12 pixels. The test, specific to mobile pages, saw 92% of eligible pages passing. This percentage was consistent for both home pages and inner or inner pages.
Core Web Vitals
Core Web Vitals (CWV) are a series of standardized metrics to help measure how a user experiences a page. Google first introduced them as a ranking factor with the page experience ranking signal This independent signal was deprecated when it was absorbed into the Helpful content system, which has since been folded into the core algorithm.
Core Web Vitals are designed to answer three human-centric questions related to performance:
- Is the page loading? Largest Contentful Paint (LCP.
- Is the page interactive? Interaction to Next Paint (INP.
- Is the page visually stable? Cumulative Layout Shift (CLS)
Core Web Vitals is measured via the page loads of real Chrome users across millions of websites and available via a public dataset, the Chrome User Experience Report (CrUX).
These metrics are designed to evolve. In March 2024, Interaction to Next Paint (INP) took over as the main measurement for interactivity from the previous metric, First Input Delay (FID), which only measured the input delay of the first interaction on a page. FID was an inaccurate measurement for a number of reasons, and many sites (particularly JavaScript-heavy sites) often falsely represented that they provided good interactivity to users. As a result, many JavaScript frameworks have seen their pass rate drop in 2024 because of this change. It should be noted, however, that currently SPAs are not accurately measured by Core Web Vitals.
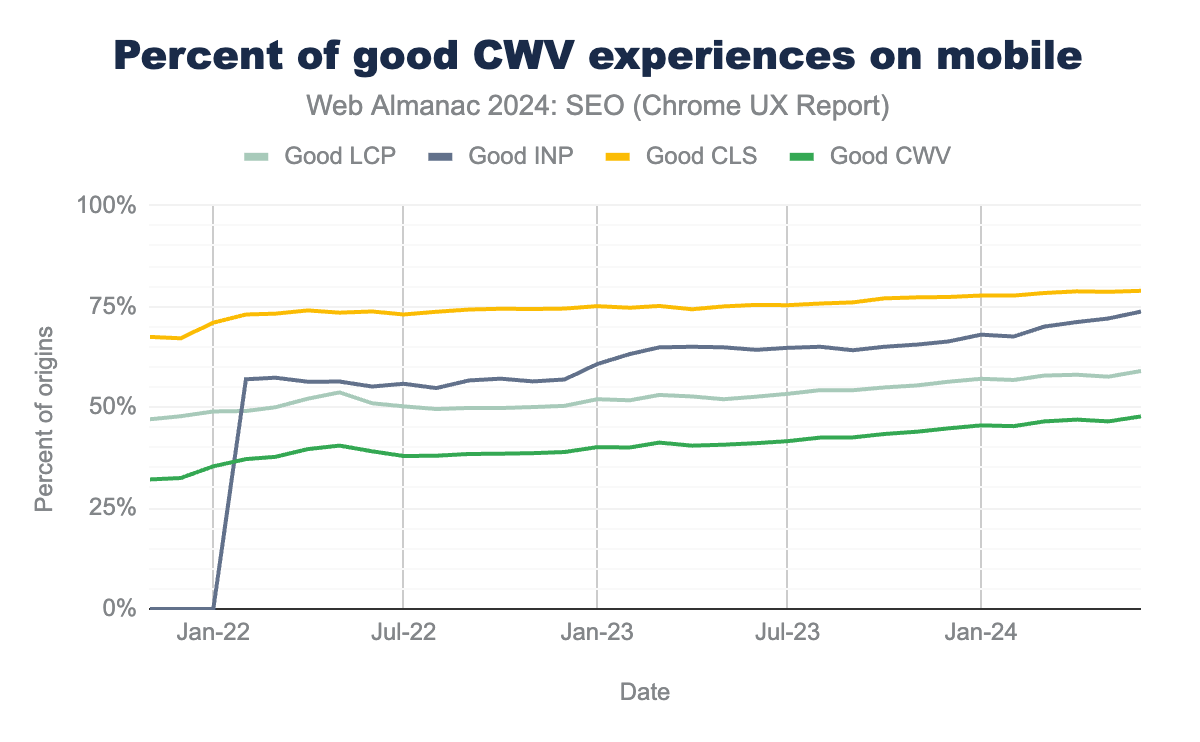
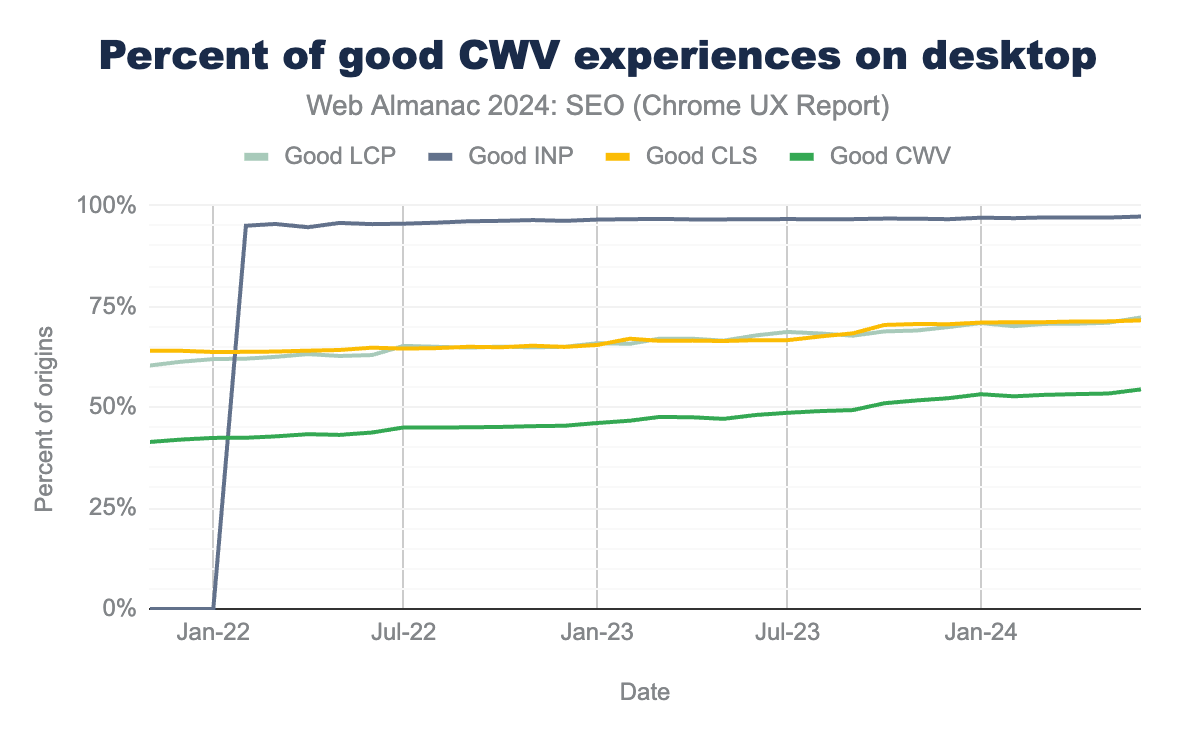
CWV assessment is divided into mobile and desktop. In 2024, 48% of mobile sites passed. The percentage of passing sites has increased each year, with 39% in 2022, 29% in 2021, and just 20% in 2020.
Looking at the metrics individually, 59% pass Largest Contentful Paint, 74% pass Interaction to Next Paint, and 79% of mobile sites pass Cumulative Layout Shift.
Desktop devices offer more leniency, as they often have higher bandwidth connections. To be sure, 54% of sites pass the desktop CWV assessment, which is 8% more than mobile. The individual metrics show much higher pass rates as well, with 72% passing LCP, 97% passing INP, and 72% passing CLS.
You can explore the Performance chapter to learn more about Core Web Vitals.
Image loading property usage
Images are a critical component when it comes to page load. Image loading properties help browsers prioritize fetching resources as they build a web page. Implementing image loading properties can benefit user experience and performance. Downstream improvements may also include improved conversions and SEO success.
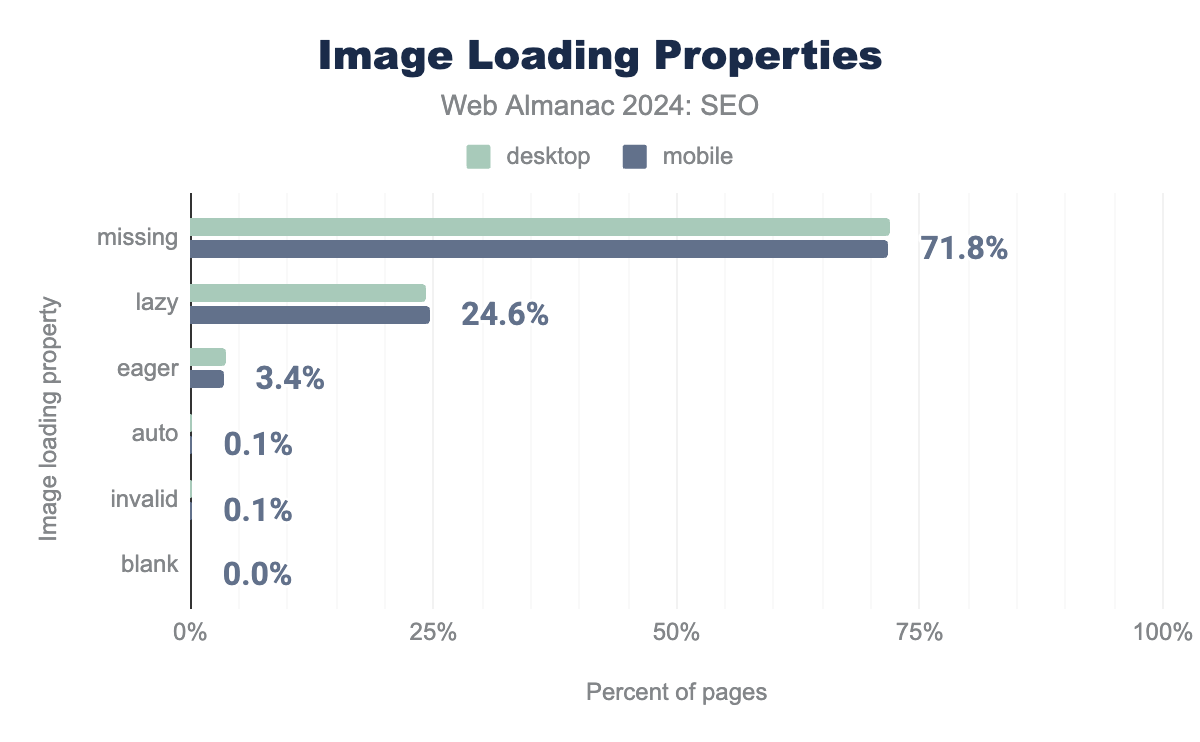
loading attribute values, on desktop 0% use auto, 0% use blank, 4% use eager, 0% have an invalid attribute, 24% use lazy and 72% are missing a loading attribute. For mobile, 0.1% use auto, 0% blank, 3% eager, 0.1% have an invalid attribute, 25% use lazy, and 72% are missing a loading attribute.
Most sites do not use these valuable signals, with 71.9% of desktop pages and 71.8% of mobile pages missing image-loading properties. The most adopted attribute was loading="lazy". Lazy loading is a technique that defers the loading of non-critical elements on a web page until they are needed. This helps reduce the page weight and conserves bandwidth and system resources. This tag was used for 24.6% of mobile pages and 24.3% of desktop pages in 2024. The increased adoption can likely be attributed to loading attributes becoming a web standard.
The counterpart to lazy loading is eager loading. A browser eagerloads images by default. Therefore, an image with the eager attribute and an image without any loading attribute will behave the same. In 2024, eager loading was the second most used property, but only appeared on 3.4% of mobile pages and 3.6% of desktop pages.
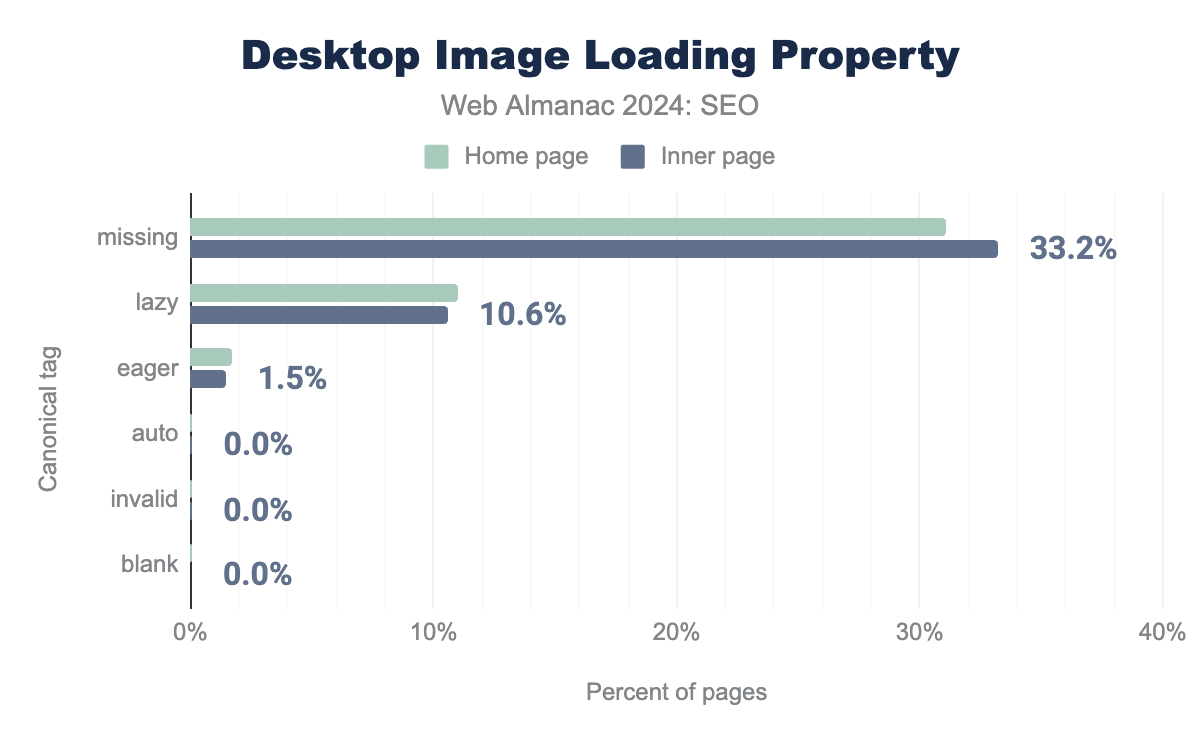
loading attribute values, on desktop pages. On home pages 0.1% use auto, 0.0% use blank, 1.8% use eager, 0.1% have an invalid attribute, 11.0% use lazy and 31.1% are missing a loading attribute. For inner, inner pages, it is 0.1%, 0.0%, 1.5%, 0.0%, 10.6% and 33.2% respectively.A third deprecated value, auto, was never standardized and has since been removed from Chrome support. It is now considered an invalid value and ignored.
lazy loading vs. eager loading iframes
Like images, iframes can also lazy-loaded through the loading attribute. Similarly to img loading attributes, auto is invalid and ignored.
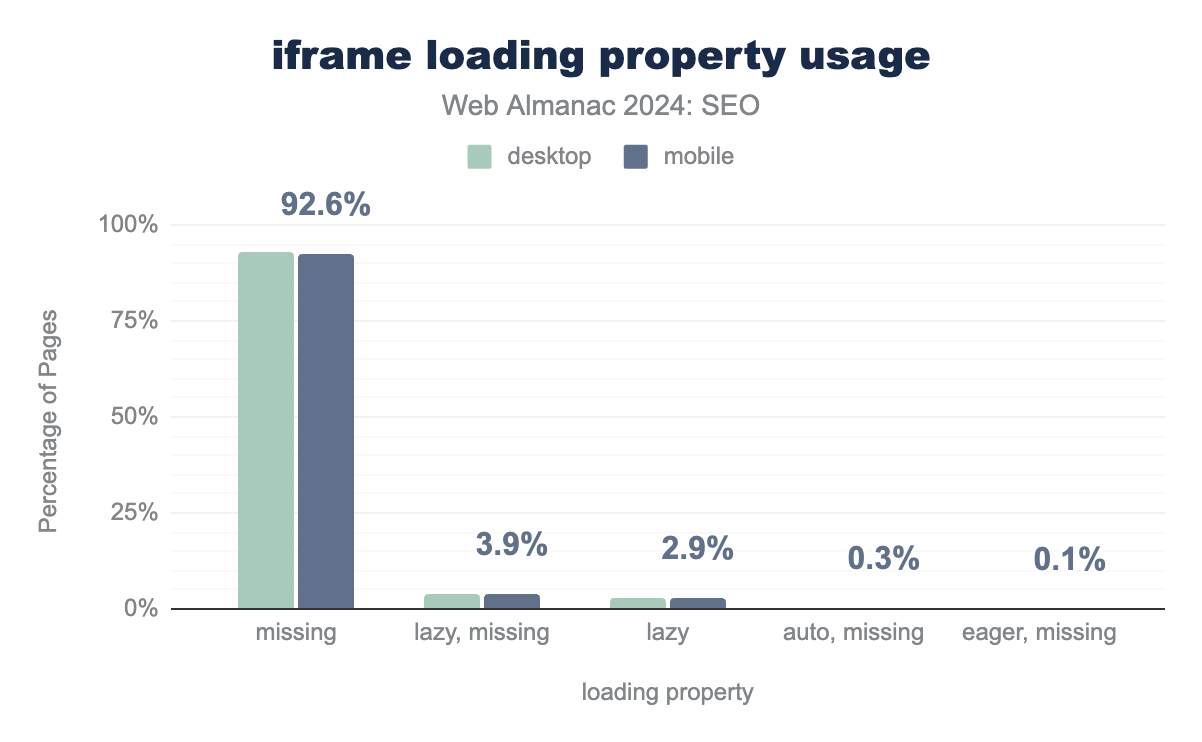
iframe loading properties. For desktop pages, 92.8% did not declare a loading attribute, 4.0% had multiple iframes that used both lazy and had no loading declaration, 2.6% used only lazy, 0.4% had multiple iframes with auto and missing attributes, and 0.1% had multiple with eager and missing attributes. Mobile behaved similarly at 92.6%, 3.9%, 2.9%, 0.3%, and 0.1%, respectively.iframe loading property usage.
Of the sites containing one or more <iframe> elements, 92.8% of desktop and 92.6% did not declare a loading property. lazy was the most prominent declaration and most often occurred when there were multiple <iframe> elements on the page. We found 4.0% of desktop and 3.9% of mobile pages had a mixed lazy loaded and <iframe> elements without a declaration. Additionally, 2.6% of desktop and 2.9% of mobile pages used the lazy attribute on all <iframe> elements discovered during the crawl.
In 2022, 3.7% of desktop and 4.1% of mobile pages used the lazy loading attribute. The attribute increased to 6.6% of desktop and 6.9% of mobile pages in 2024.
Since <iframe> elements can be controlled by either the site on which the page is hosted or a third-party service, the prevalence of loading attribute combinations suggests that sites are adopting loading attributes wherever possible. It is reasonable to assume that third-party controlled <iframe> elements are less likely to have attributes.
On-page
When determining which pages to return in a search engine results page (SERP), search engines consider the on-page content as the primary factor. There are various SEO on-page elements that impact a search engine’s understanding of content and its relevance to a user query.
Metadata
On-page content is the main measurement of a page’s relevance to a particular query. Certain HTML elements, such as title elements and meta descriptions, may appear in a Search Engine Results Page (SERP), but they are often just used as signals about the page’s content.
In 2021, Google started rewriting more websites’ title tags in their search results. As search engines have become less likely to use the direct content from these tags, their adoption rates have decreased.
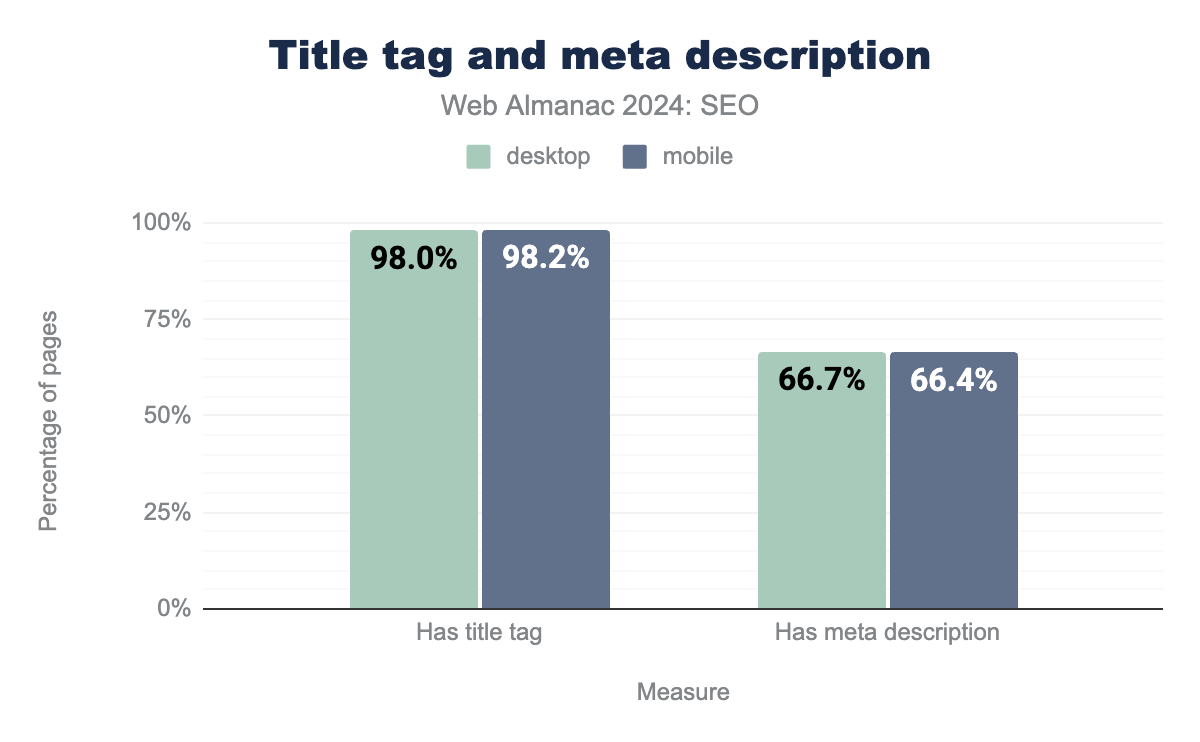
title tag and meta description. In 2024, 98% of desktop pages had a title element and 66.7% of desktop pages had a meta description. The numbers for mobile pages were nearly similar, with 98.2% having a title element and 66.4% having a meta description.In 2022, 98.8% of desktop and mobile pages used the title tag. Now in 2024, 98.0% of desktop pages have a title tag and 98.2% of mobile pages have one. Similarly, meta description usage dipped from 71% of desktop and mobile home pages in 2022 to 66.7% of desktop and 66.4% of mobile home pages in 2024.
<title> element
The <title> element populates the name displayed in a browser tab, and is one of the strongest on-page elements related to the page’s content and a query’s relevance.
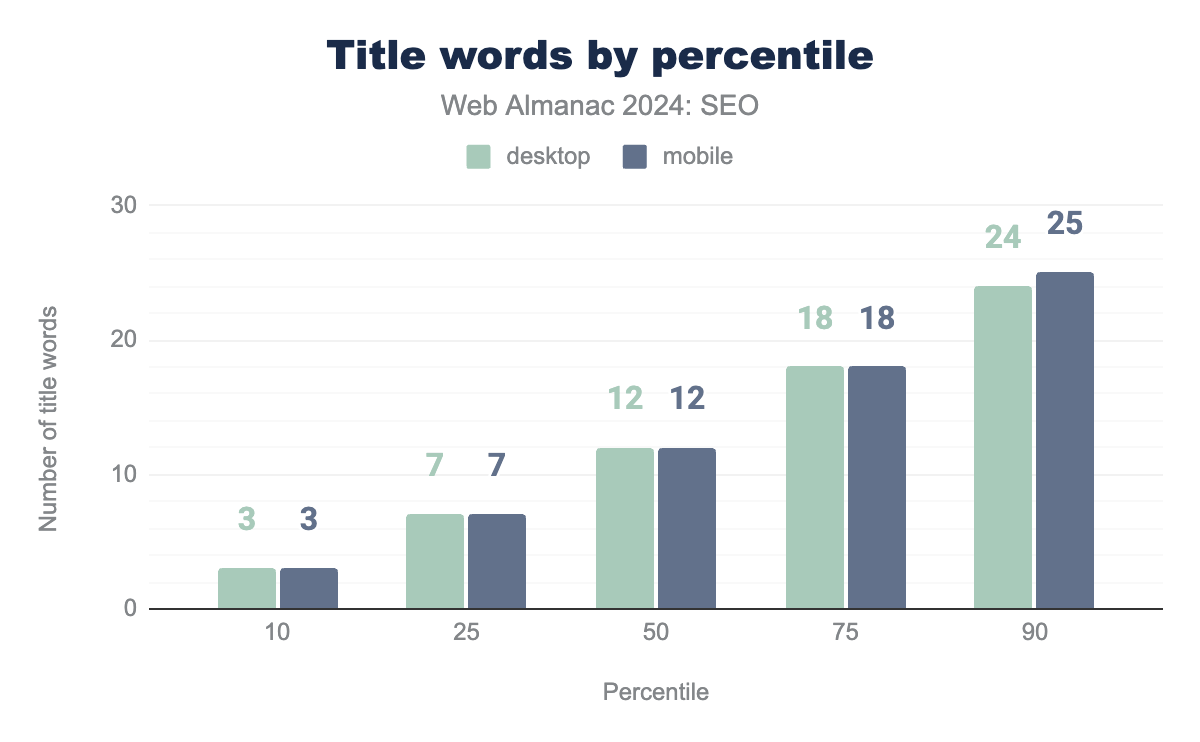
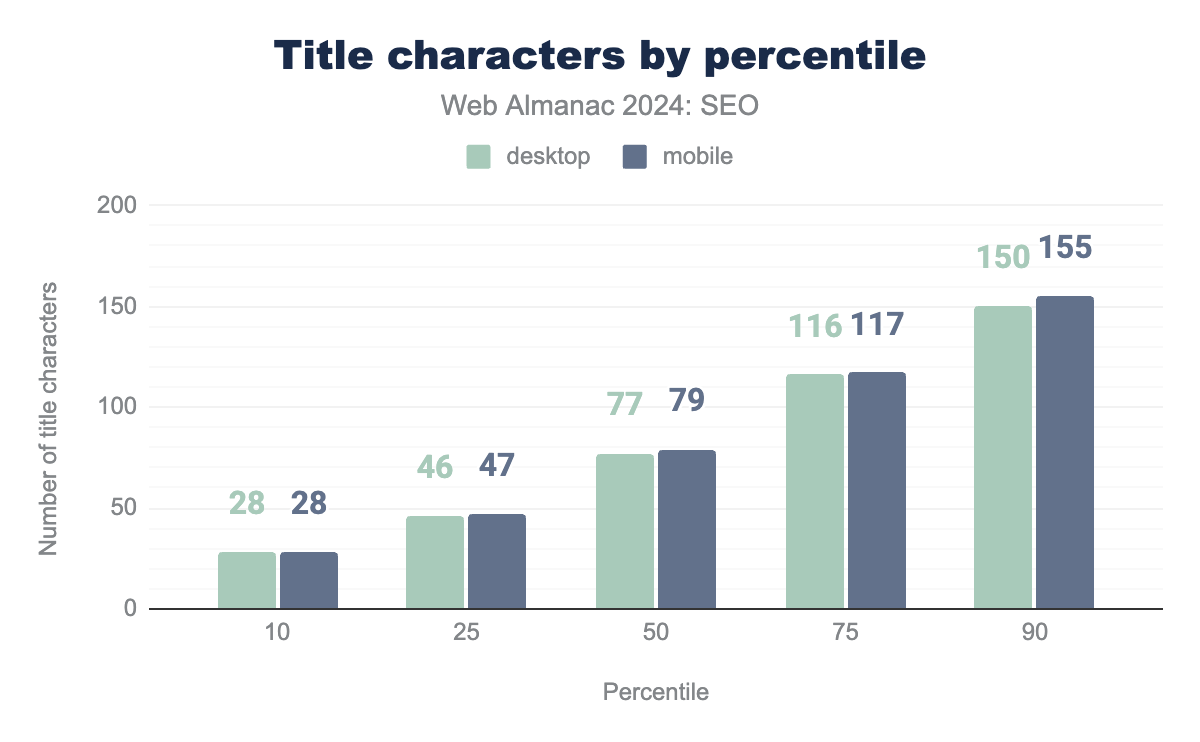
The word count in title elements was consistent between mobile and desktop experiences, though the character count was slightly higher for mobile with 79 characters compared to 77 words for desktop at the median.
Meta description tag
While the <meta name="description"> tag is not a ranking factor, for some search engines and queries, the content within this tag may appear in SERPs and influence click-through rate.
Today, search engines like Google primarily create snippets to display in the SERPs from on-page content, based on the query. One study showed that 71% of meta descriptions are rewritten for the first page of results.
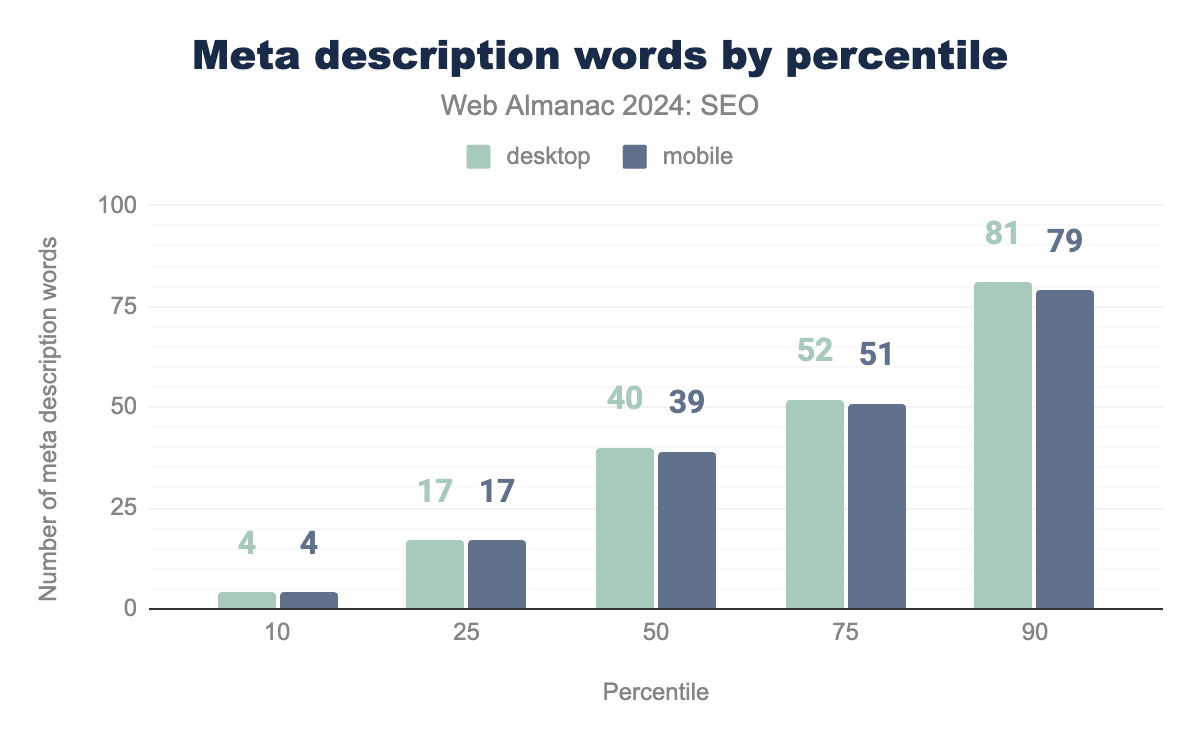
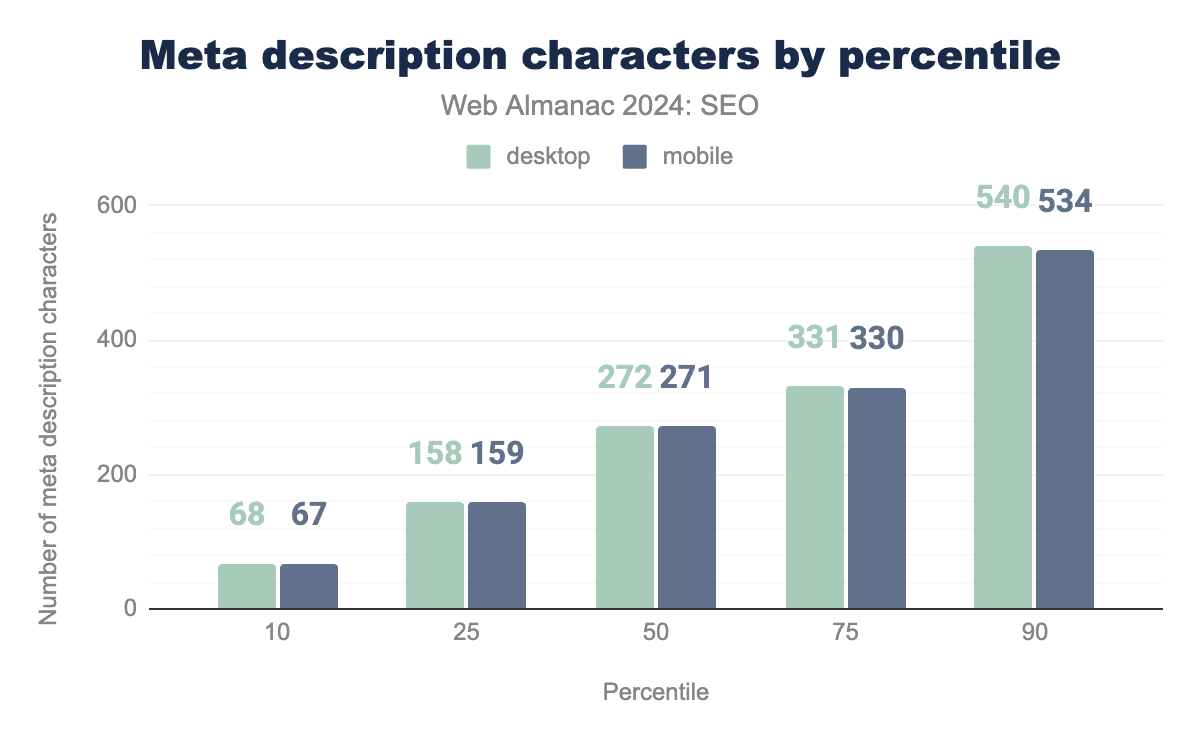
meta descriptions on desktop and mobile. Distributions are even at the 10th percentile, with four words and also at the 25th percentile, with 17 words. The median page has 40 words for desktop and 39 words for mobile. At the 75th percentile, desktop pages have 52 words and 51 words for mobile pages. At the 100th percentile, desktop meta descriptions contain 81 words while mobile pages have 79 words.meta descriptions on desktop and mobile. At the 10th percentile, desktop has 68 characters and mobile has 67 characters. The median desktop page has 272 characters while the median mobile page has 271 characters. At the 75th percentile, desktop has 68 characters and mobile has 67 characters. At the 90th percentile, desktop has 540 characters and mobile has 531 characters.In 2024:
- The median desktop and mobile page
<meta name="description">tag contained 40 and 39 words, respectively. That represents a 110% increase in word count for mobile and 105% increase for mobile since 2022. Two years ago, the median for both desktop and mobile was just 19 words. - The median desktop and mobile page
<meta name="description>tag contained 272 characters and 271 characters, respectively. That’s a 99% increase for both device types compared to 2022. - At the 10th percentile, the mobile and desktop
<meta name="description>tag contained 4 words. - At the 90th percentile, the
<meta name="description>tag contained 81 words on desktop and 79 words on mobile.
Header elements
Header elements are used to establish the semantic structure of a page. They are important to a search engine’s understanding of a page since they help organize the page’s content. They follow a hierarchical order with <h1> used to describe the overall on-page content and subheaders such as <h2>, <h3> and so on to describe sections and subsections.
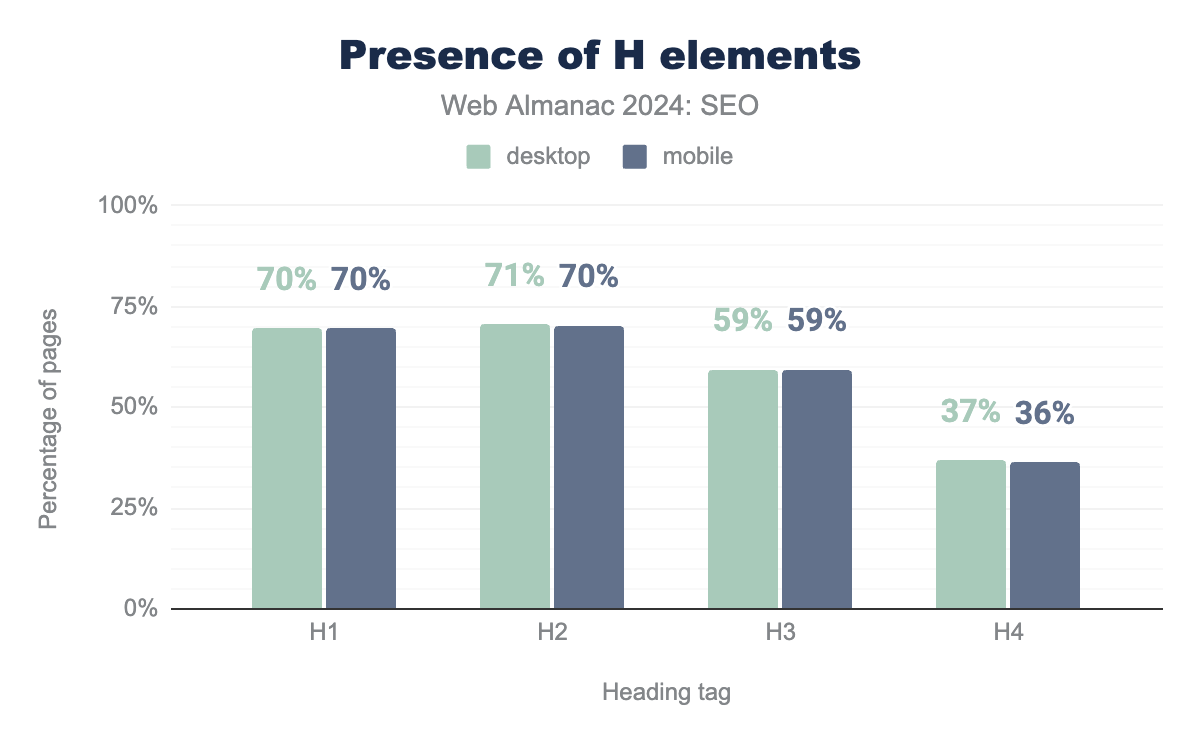
<H1> tags through <H4> tags. On desktop, 70% of pages have an <H1> tag, 71% have an <H2> tag, 59% have an <H3> tag, and 37% have an <H4>tag. The percentages are slightly lower on mobile at 70%, 70%, 59%, and 36%, respectively.Header elements have been widely adopted because they’re easy to implement and help improve understanding for users and bots. For desktop pages in 2024, 70% had <h1> tags, 71% had <h2> tags , 59% had <h3> tags, and 37% had <h4> tags. Mobile pages were similar at 70%, 70%, 59%, and 36%, respectively.
These numbers vary slightly from 2022. Notable shifts in 2024 include increased adoption of <h1> tags, which in 2022 was at 66%. The subsequent headers, however, saw decreased usage. The <h2>, which was 71% in 2024 , was previously at 73% in 2022 for both device types. Meanwhile, the <h3> and <h4> tags, which were 59% and 37% in 2024, were higher in 2022 at 62% and 38%, respectively.
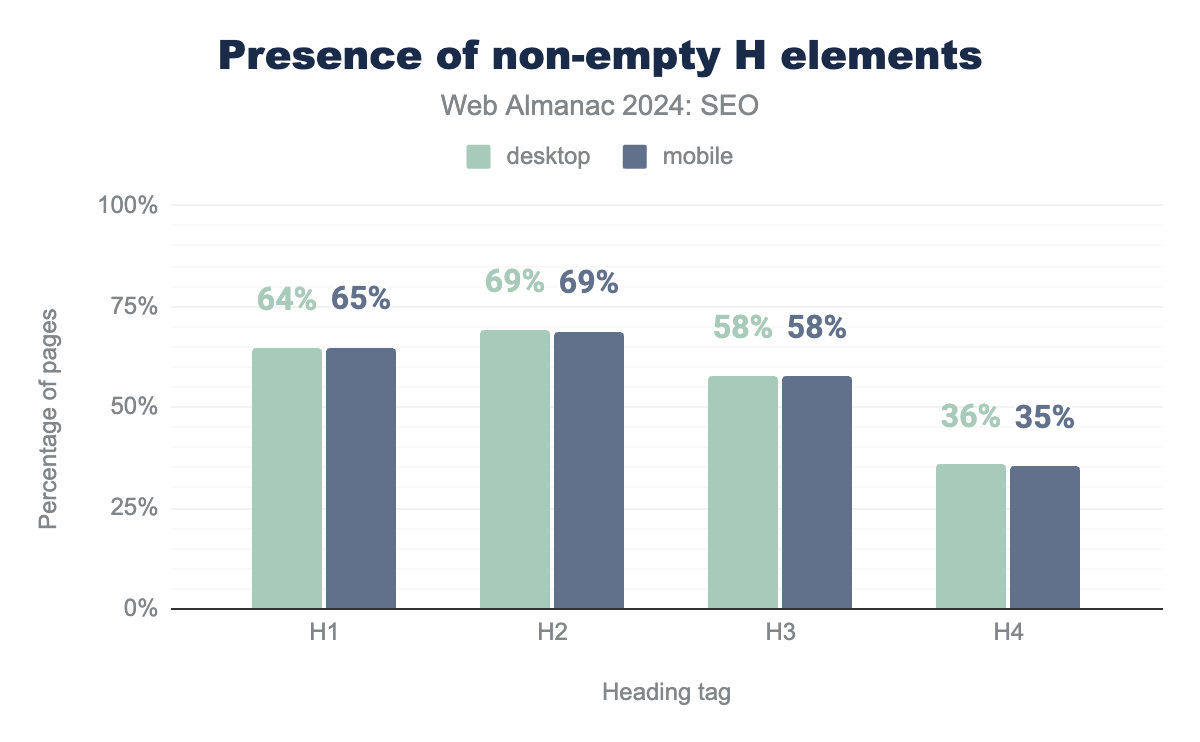
<H1> tags through <H4> tags. On desktop, 70% of pages have an <H1> tag, 71% an <H2> tag, 59% an <H3> tag, and 37% an <H4> tag. The percentages are slightly lower on mobile at 70%, 70%, 59%, and 36%, respectively.In a continued trend from prior years, relatively few header elements are left empty. The most common empty header elements is the desktop <h1> at 6%.
Images
Images make the web a richer experience. The median page features 14.5 images (with marginal differences between device types). Image use is notably higher for home pages, which have an average of 18.5 images compared to 10.5 images on inner pages.
For more information on image use and weight, see the Page Weight chapter.
alt attributes
The image alt attribute provides information about the image for those who, for whatever reason, cannot view it. Its primary purpose is accessibility. Search engines also use the tag for indexing images since they can provide useful content. Therefore, alt tags are considered when serving and ranking images in search engine result pages.
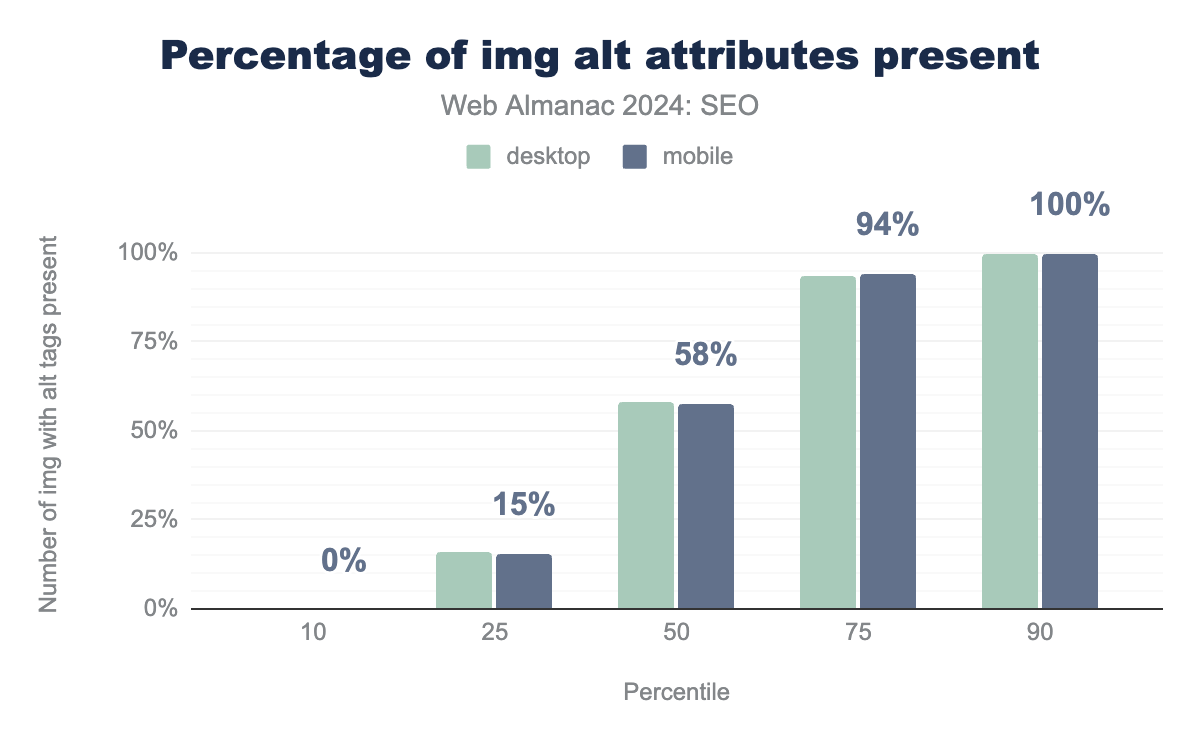
<img> tag implementing alt attributes. The median usage of images with alt attributes is 58.3% on desktop and 57.8% on mobile. At the 10th percentile it’s 0% for both, at the 25th percentile it’s 16.0% and 15.5%, at the 75th percentile it’s 93.8% and 94.2% and at the 90th percentile it’s 100% for both.<img> with alt tags present.
The median mobile site in 2024 had alt attributes on 58% of its images. That’s slightly up from 2022 when 54% of mobile pages used alt tags.
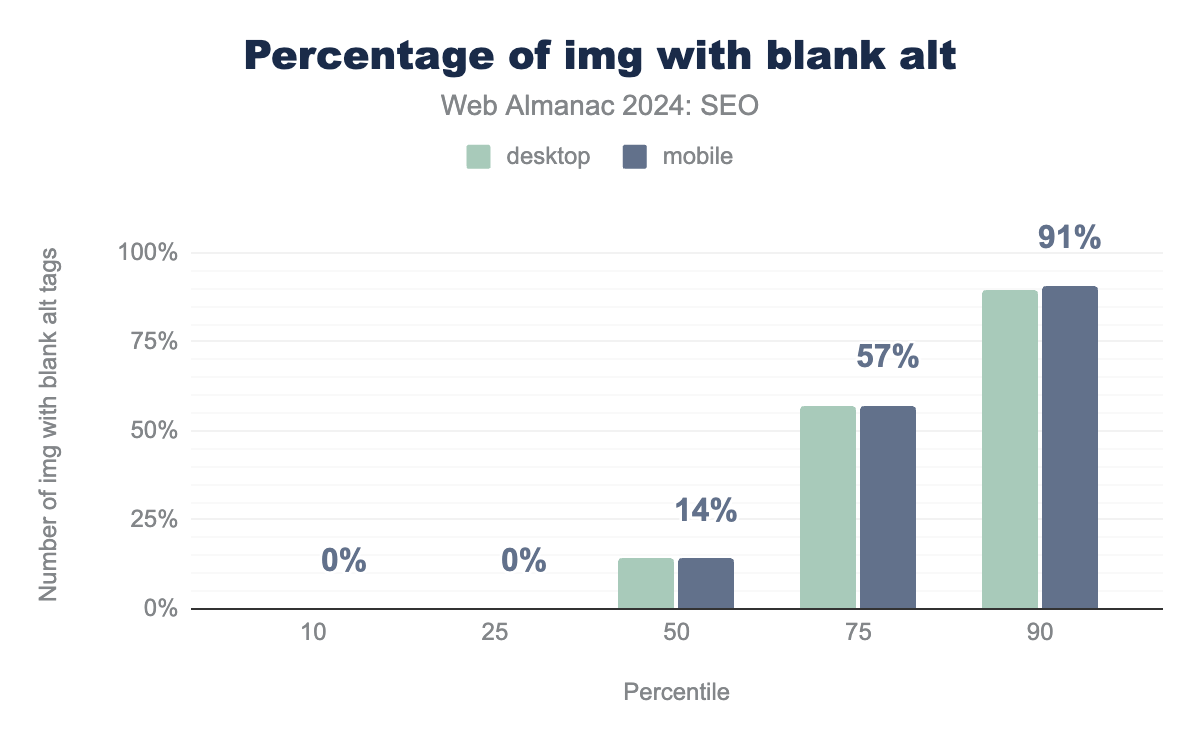
<img> element implementing empty alt attribute. At the median, 14% of mobile and 14% of desktop have an alt attribute that is empty. At the 75th percentile, this rises to 57% of mobile and 57% of mobile. At the 90th percentile, empty alt attributes appeared on 91% of mobile and 90% of desktop.<img> with blank alt tags.
There was an increase in blank alt attributes in 2024. Two years ago, the median page had 0% blank alt attributes. Now the median is 14% of desktop pages and 14% of mobile that are left blank. At the 75th percentile, 57% of desktop and 57% of mobile pages saw blank alt attributes.
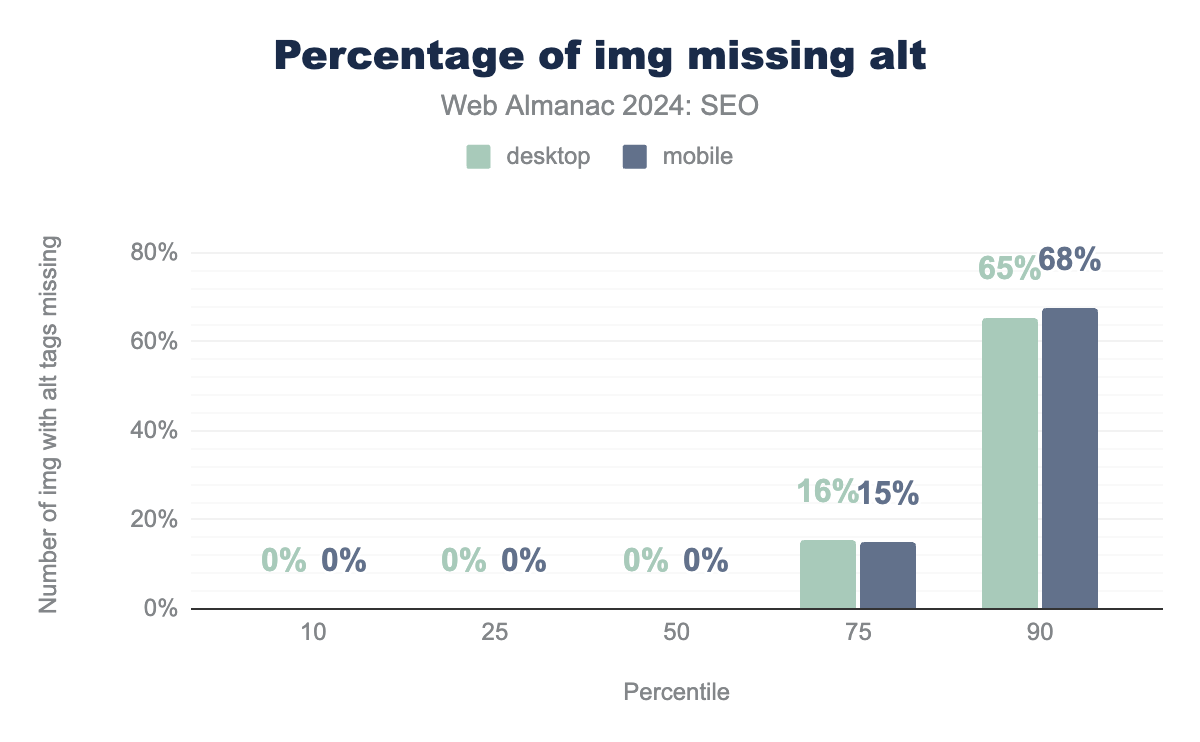
alt attributes. The median of missing alt attributes on images is 0% on desktop and mobile sites. At the 10th and 25th percentiles, it’s also 0% on both, above the median (at the 75th percentile), it’s 16% on desktop and 15% on mobile. Finally, at the 75th percentile, it’s 65% of images on desktop and 68% on mobile.img with missing alt tags.
In 2024, the median page saw no missing alt attributes on either mobile or desktop pages. This is a noteworthy drop from 2022 when 12% of desktop pages and 13% of mobile pages were missing the attributes. At the 75th percentile, 16% of desktop pages and 15% of mobile pages did not include alt attributes. In 2022, this was 51% and 53%, respectively.
The decrease in missing <img> alt attributes combined with the increase in blank attributes suggests that more CMS instances may be including an alt attribute for each image.
Video
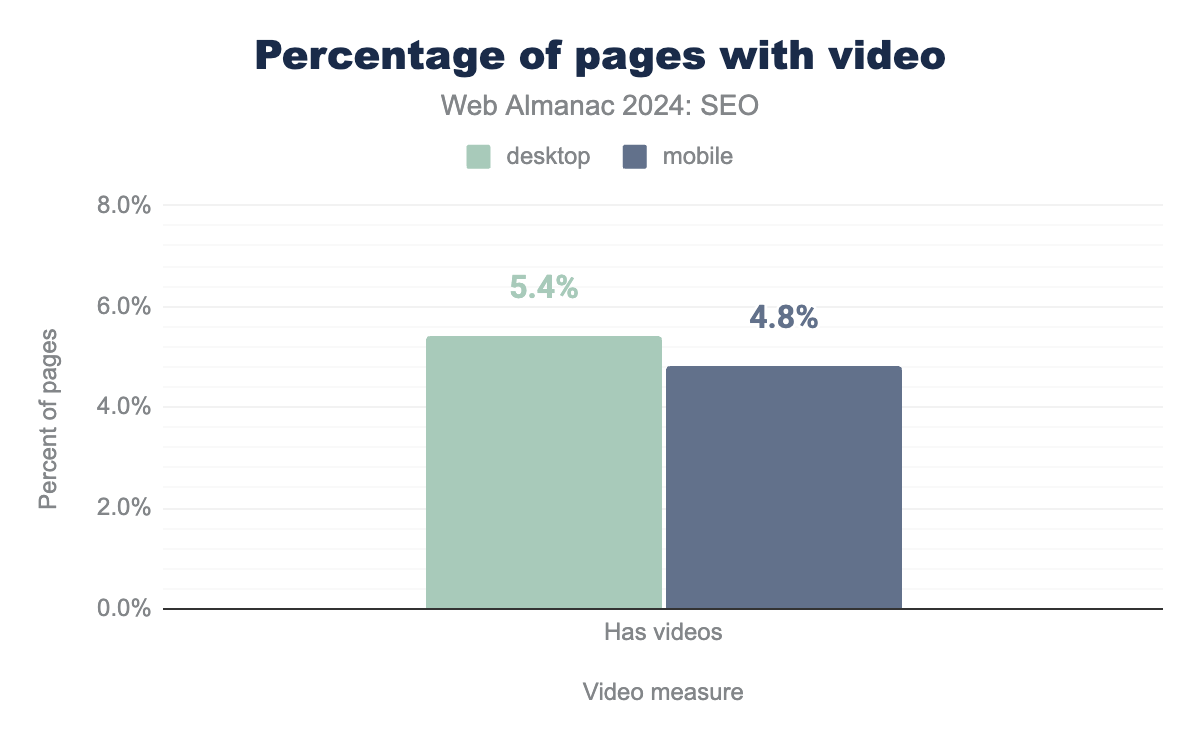
Only 0.9% of pages had the VideoObject structured data markup in 2024. While this is more than double the 0.4% rate of 2022, it means there is still a significant gap between the percentage of pages that have video and those that have video and schema for it.
Links
Links on a page are used by search engines in a number of important ways.
One of the methods that search engines employ to discover new URLs for crawling, for example, is by finding a link targeting it from a page that they’re already crawling and parsing.
Search engines also use links for ranking. Links serve as a proxy for how important and relevant a particular URL might be, based on the links targeting it. This is the basis of PageRank, an algorithm on which Google was built.
When it comes to links, it is not a simple case of more links equals better ranking. There’s a lot more nuance to it. These days, links are less of a factor when it comes to ranking. Search engines have evolved to better detect and rank great content, irrespective of links and, at the same time, to combat manipulation and link spam.
Non-descriptive links
The anchor text of a link, which is the hyperlinked text you click on, helps both users and search engines understand the content of the targeted linked page. Non-descriptive anchor text, such as ’More Info’ or ’Click Here’, doesn’t have any inherent or contextual meaning, and is a lost opportunity from an SEO perspective. It is also bad for accessibility and those who use assistive technologies.
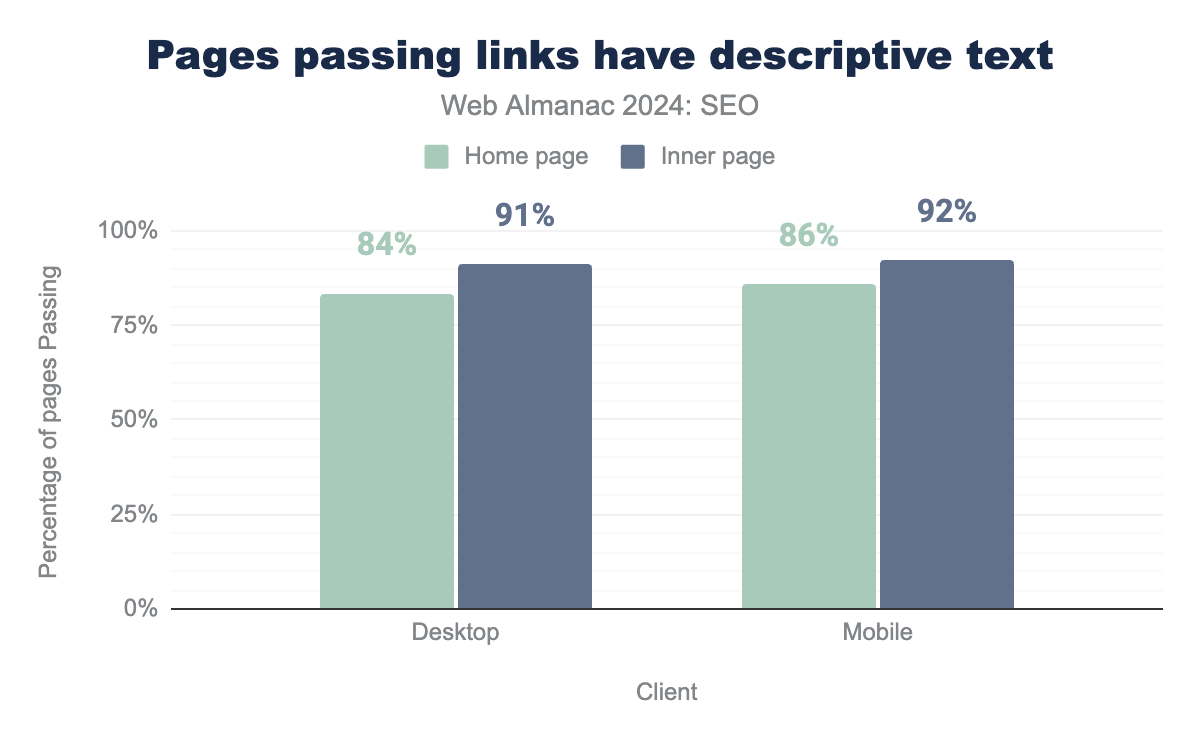
Lighthouse can detect whether there are non-descriptive links on a page. In 2024, 84% of desktop and 91% of mobile pages passed this test. And for inner pages, it was 86% of desktop pages and 92% of mobile pages that passed.
There was a small discrepancy between desktop and mobile, indicating perhaps that on mobile pages there may generally be less poorly indicated call to action links and ’click here’ or ’read more’ additional links to content, as they might be supplemental to other links on the page to the same target.
Outgoing links
Outgoing links are <a> anchor elements that have an href attribute linking to a different page.
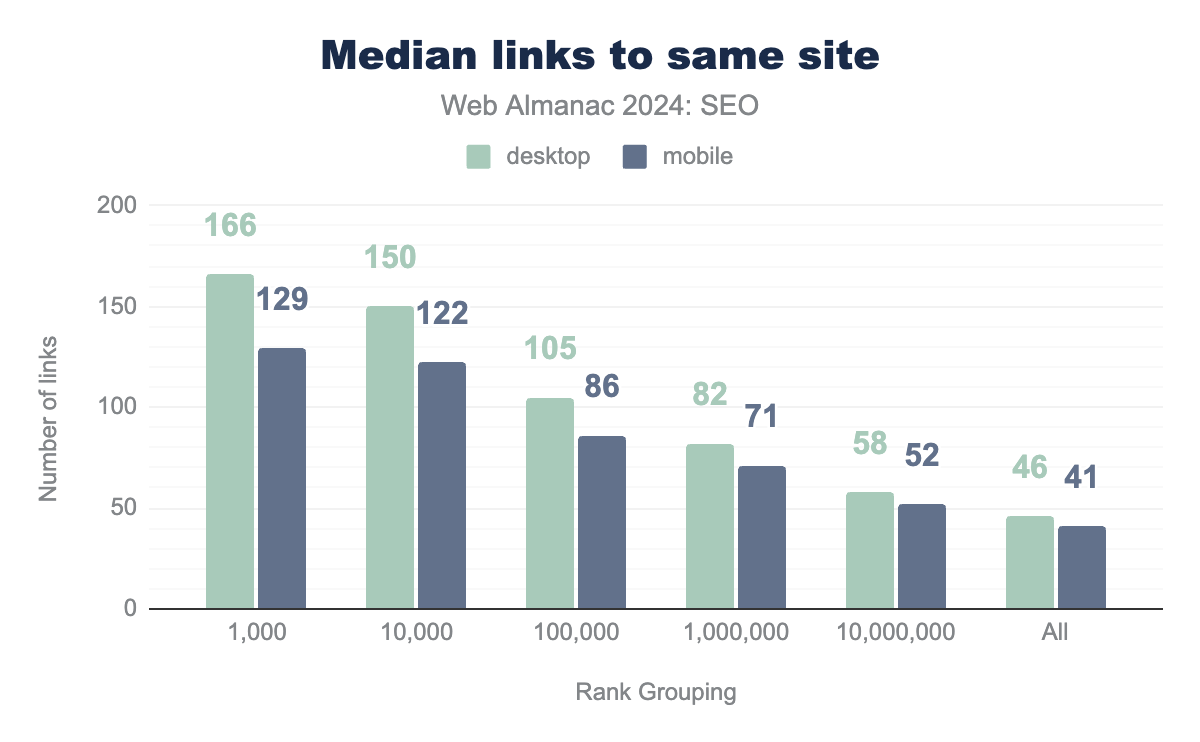
Internal links are links to other pages on the same website. The trend continues from 2022 in which desktop pages have more internal links than mobile pages do. This is most likely attributed to developers minimizing the navigation menus and footers on mobile for ease and to accommodate the smaller screens.
Overall, the number of internal links on a page have grown, with pages in the top 1,000 sites now having 129 internal links on mobile compared to 106 internal links in 2022. There has been a similar level of growth across all rank groupings.
According to CrUX ranking data, it’s clear that the more popular sites have more outgoing internal links. This might simply be because the more visited sites are bigger entities with more useful internal links, as well as their investment in developing ’mega-menu’ type navigation to help them handle more pages.
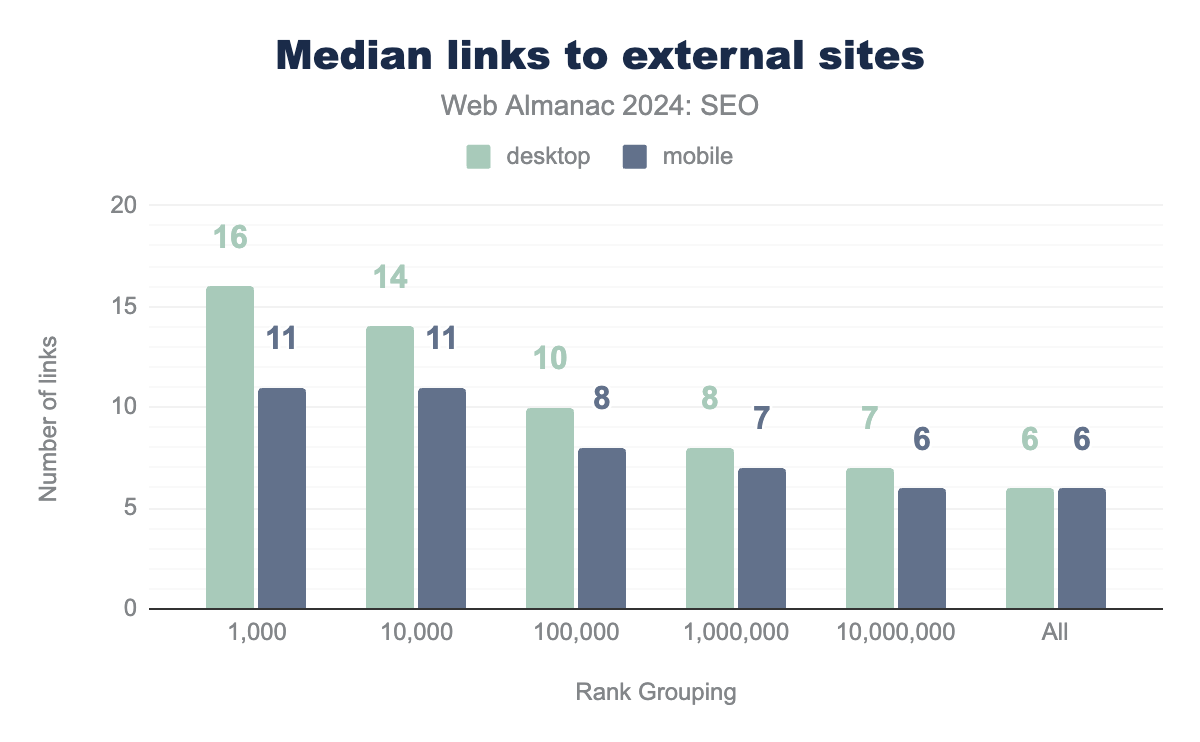
External links are links that point to other websites. The link count has remained remarkably similar to that in 2022’s chapter. There is very slight growth, consisting of one or two links.
Similarly, the more popular sites tend to have more external links, but again the difference is very slight.
Anchor rel attribute use
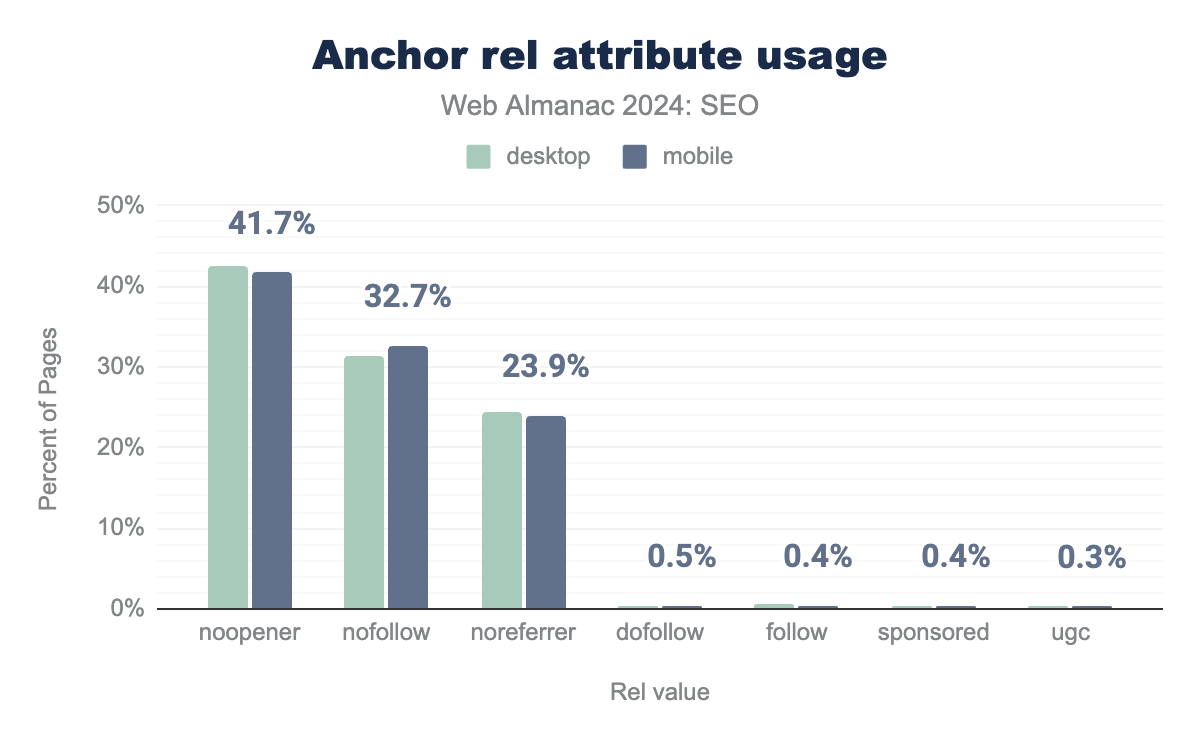
noopener, nofollow, noreferrer, dofollow, sponsored, ugc, and follow. On desktop, noopener is used on 42.6% of sites, nofollow on 32.4% of sites, noreferrer on 24.5% of sites,dofollow on 0.4% of sites, follow on 0.4% of sites, sponsored on 0.4% of sites, and ugc on 0.4% of sites. Mobile is almost identical with 41.7%, 32.7%, 23.9%, 0.5%, 0.4%, 0.4% and 0.3% of sites, respectively.rel attribute usage.
The rel attribute dictates the relationship between the page and its linked target. For SEO, the primary use of the rel attribute is to inform search engines of its relationship with the page. Google terms this as qualifying outbound links.
The nofollow attribute, first introduced in 2005, is intended to inform search engines that you don’t want to be associated with the targeted site nor wish them to crawl it based on links on your page. In 2024, the attribute was present in 32.7% of pages, up from 29.5% of pages in 2022.
Some more specific attributes were introduced in 2019, including sponsored, which denotes a link to sponsored content and ugc, which denotes links to user-generated content added by users (rather than publishers). Adoption of these attributes remains low. In 2024, it was just 0.4% for sponsored and 0.3% for ugc. Both were less popular than or equal to dofollow and follow, which actually aren’t even real attributes and are ignored by search engines.
Interestingly, the most popular attribute is noopener, which is not related to SEO, and is just to prevent a page opened in a browser tab or window from accessing or having control over the original page. Additionally, noreferrer, which also has no effect on SEO, prevents the passing of the Referrer HTTP header, so the target site doesn’t know where the visitor came from, unless unique tracking parameters are present in the link.
Word count
Search engines do not rank sites based on word count; however, it is a useful metric for tracking how much text sites contain, as well as a proxy for seeing how much site owners are leaning on client-side rendering to display the content for which they want to be found.
Home pages rendered word count
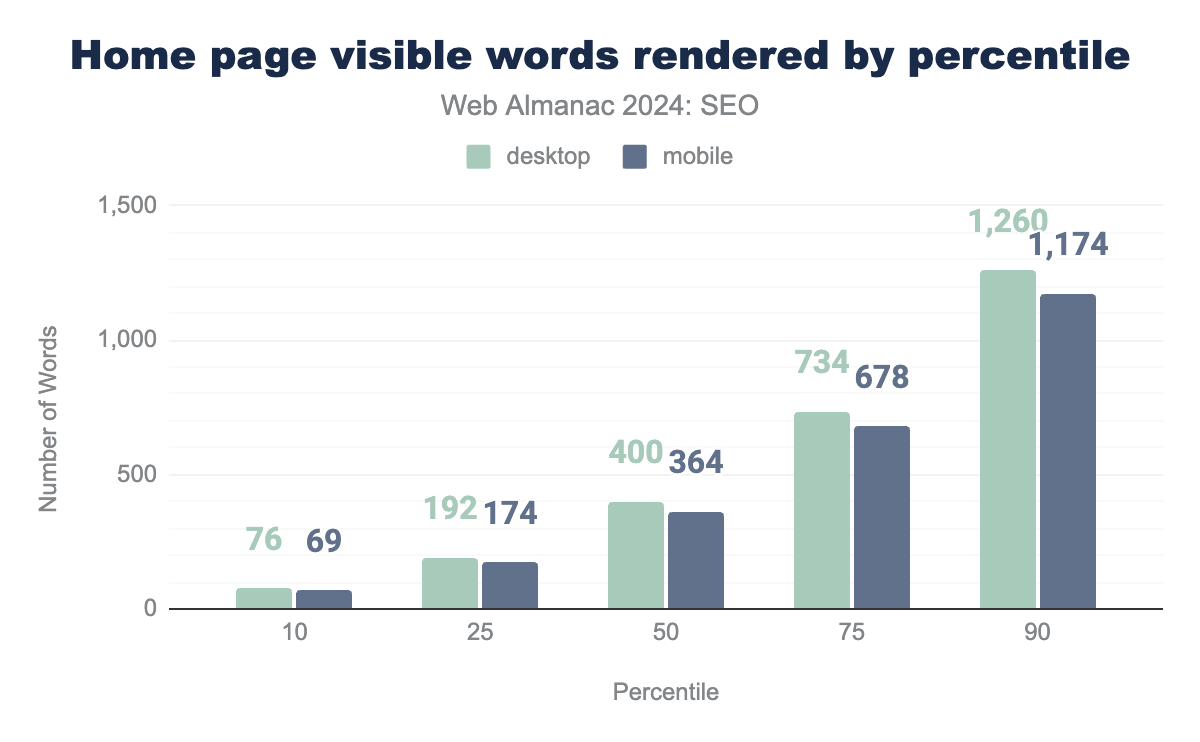
Rendered word count is the amount of visible words on a page after JavaScript has been executed. The median mobile home page in 2024 contained 364 words, while the median desktop page had slightly more at 400 words. This was a small drop from the data in 2022 when the median was 366 words for mobile home pages and 421 words for desktop.
Of note, the gap between mobile and desktop home page word counts narrowed to just 36 words in 2024, compared to that of 55 words in 2022. This suggests a marginally closer parity to the content served to mobile users. Google has completed the process of moving to a mobile-first indexing strategy, in which it primarily crawls and indexes pages with a mobile user agent. It’s reasonable to conclude that this helped push a few remaining sites to offer their full content to mobile visitors.
Inner pages rendered word count
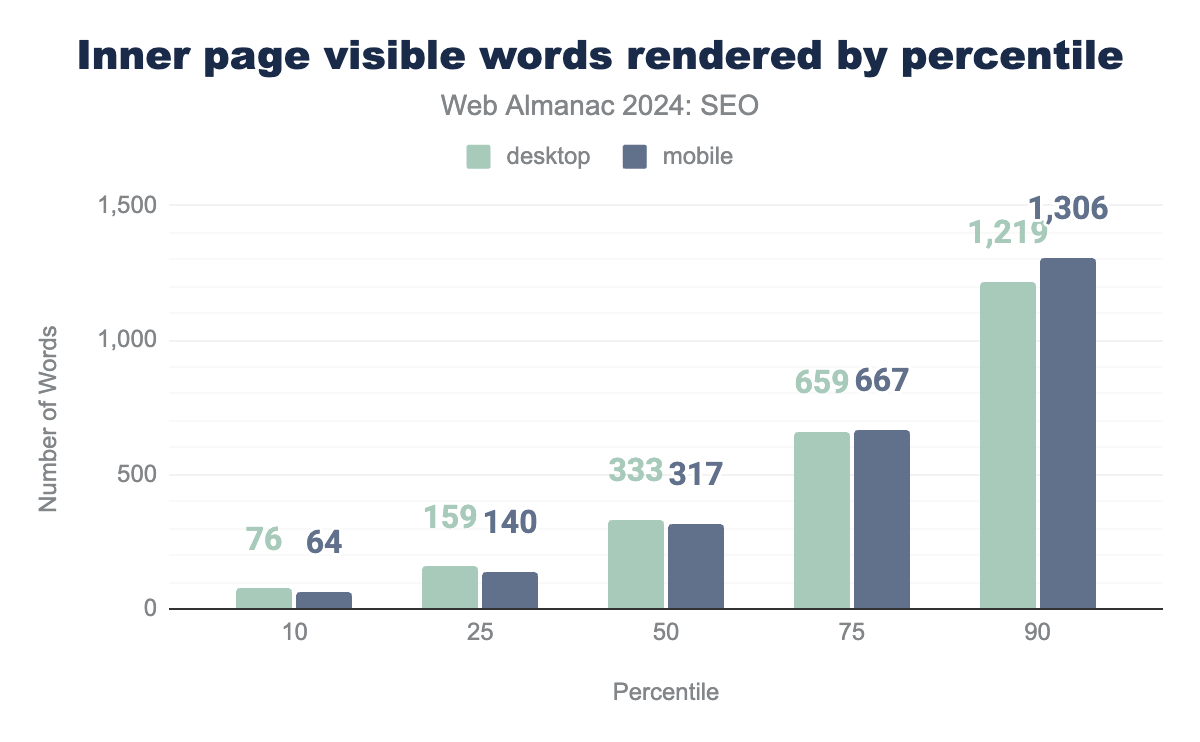
Inner pages contain slightly fewer words overall. The median mobile inner page in 2024 had 317 visible words after rendering, while desktop inner pages had 333 words.
One noticeable difference between home pages and inner pages is that while desktop pages generally have more words than mobile pages at the lower word counts, that gap narrows as the percentiles get higher. By the 75th percentile, for instance, mobile pages have more visible words on their inner pages than desktop’s inner pages.
Home pages raw word count
The raw word count represents the words contained in the initial HTML response from the server before JavaScript is executed and no other modifications have been made in the DOM or CSSOM.
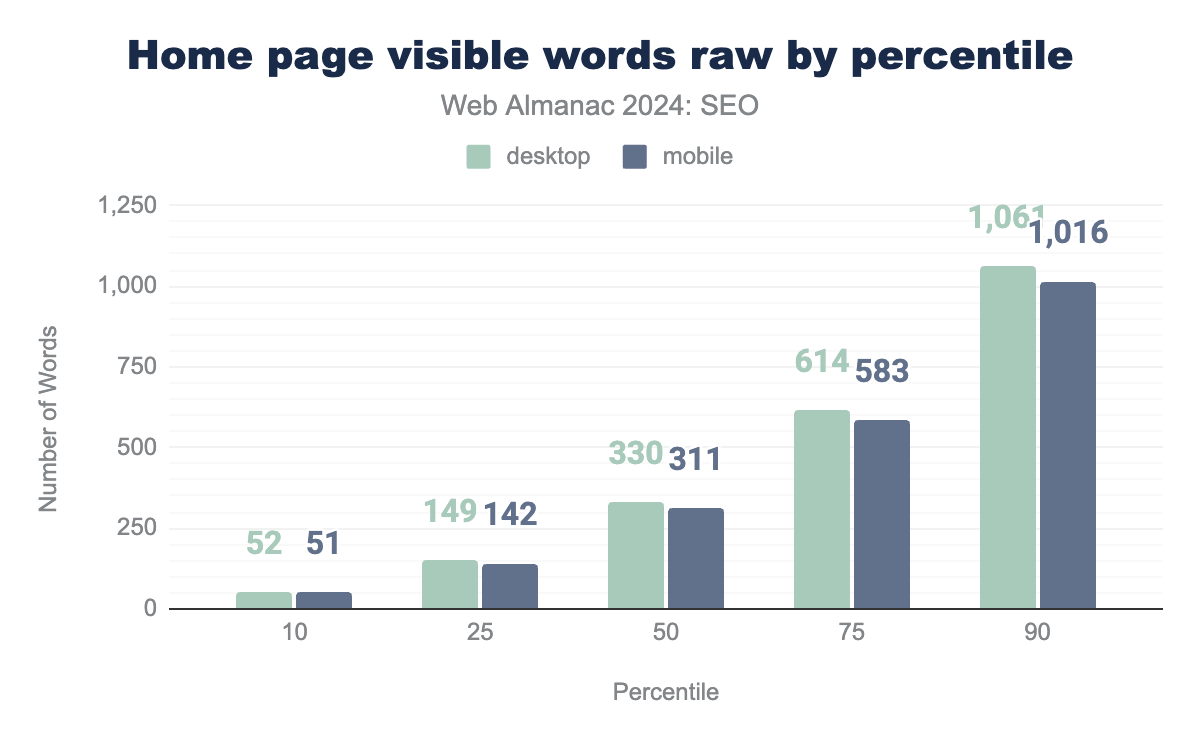
Much like the rendered word count, there’s similarly a small change in 2024 from 2022. The median page’s raw word count in 2024 was 311 words for mobile user agents and 330 words for desktops. That’s a tiny drop from 2022 when the median page’s raw word count was 318 for mobile and 363 for desktop.
Inner pages raw word count
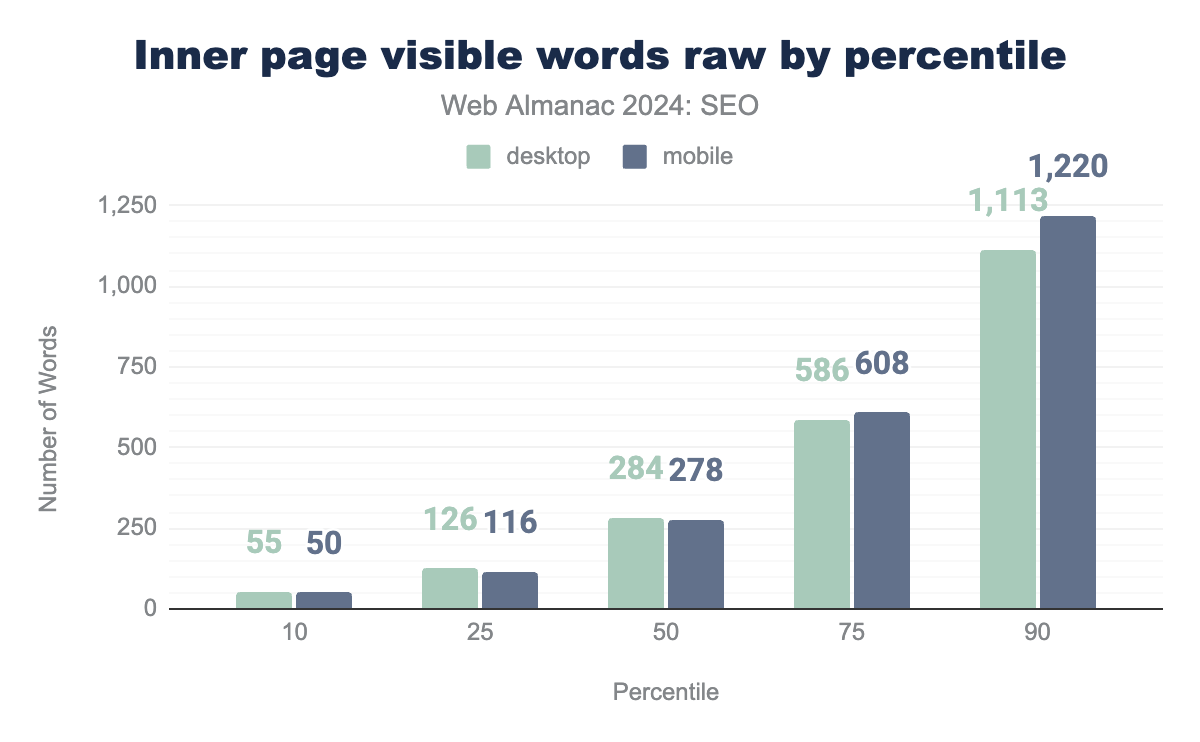
Like home pages, the inner pages’ visible words raw count very much follows the rendered word count figures, including mobile pages containing more words than desktop pages at the 75th percentile and above.
This pattern in both the raw word count and rendered word count pages suggests the trend is unrelated to infinite scrolling, which is a more popular choice for publishers on mobile layouts.
Rendered vs. raw home pages
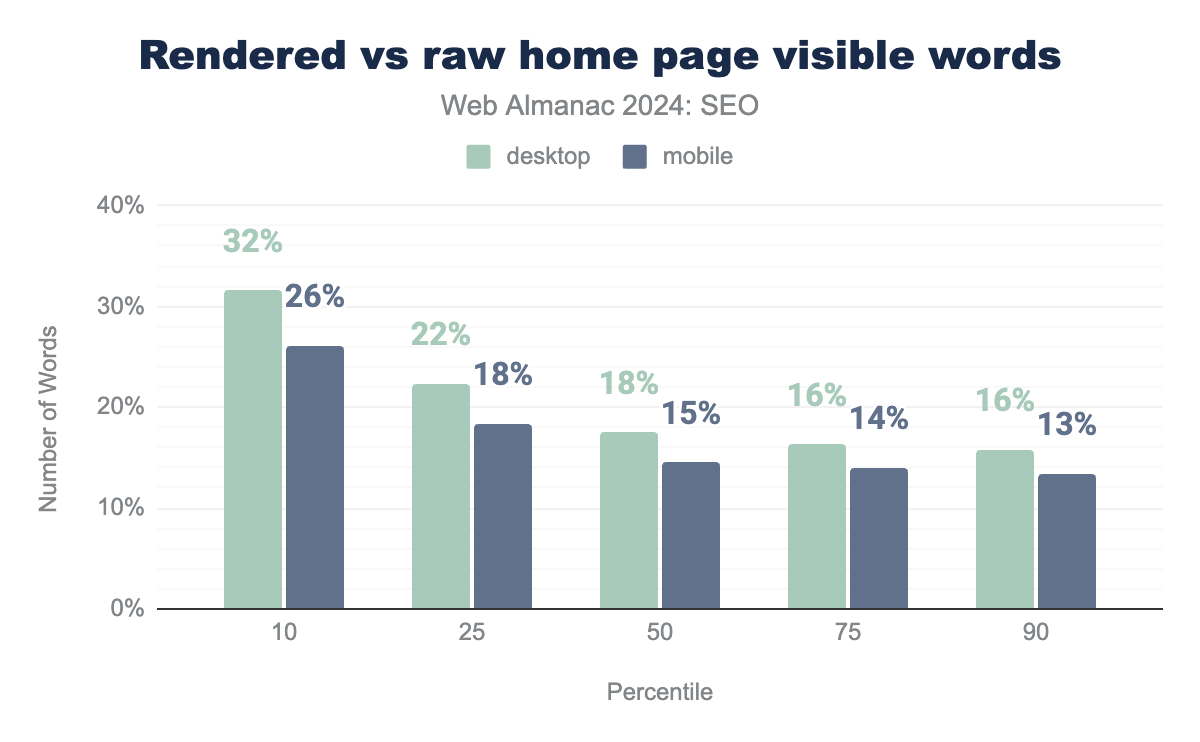
When the rendered visible and raw word counts are compared on home pages, there’s a surprisingly small discrepancy, with the median showing a difference of 13.6% for mobile and 17.5% for desktop.
Home pages served to desktop user agents have a slightly higher percentage of words visible after rendering versus mobile. One possible factor is that mobile layouts often employ tabs or accordions where, even if the content is in the DOM, it’s visually hidden, so it wouldn’t show up as visible.
There is an interesting trend in which the higher the word count there is, the smaller the difference between rendered and raw word count. This suggests perhaps that server-side rendered technologies are relatively more popular than client-side rendered ones for publishers of longer-form content.
Rendered vs. raw inner pages
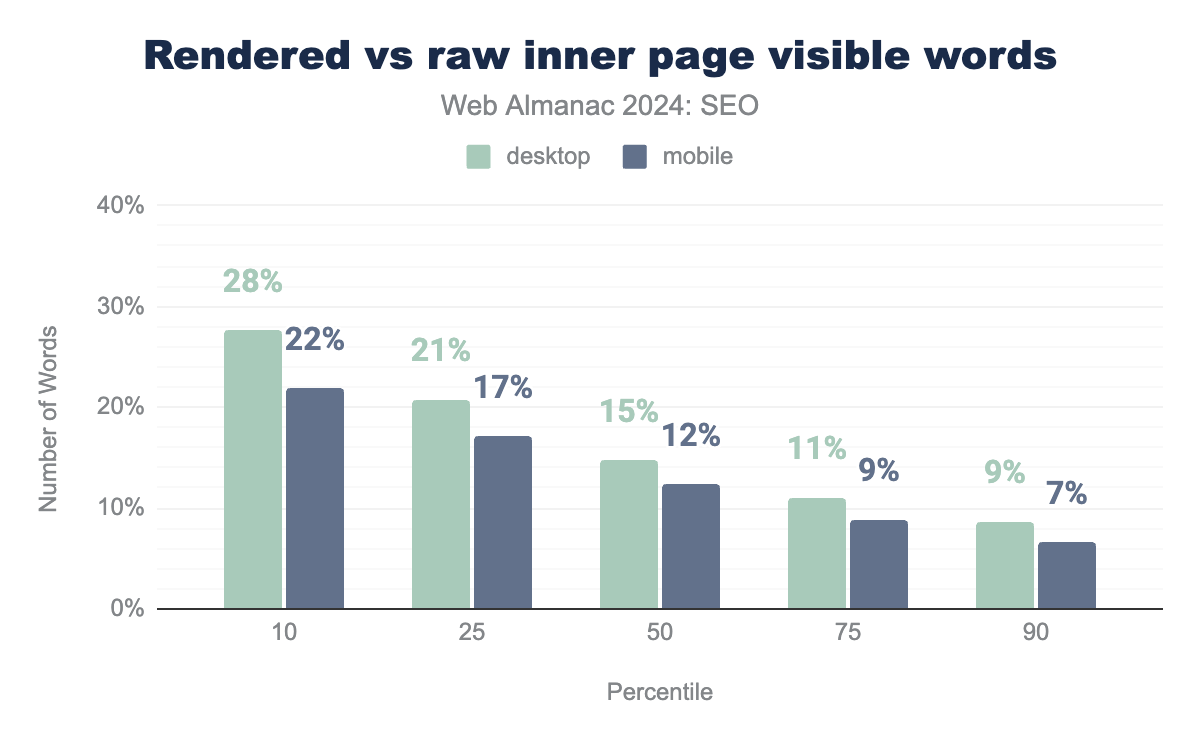
Somewhat surprisingly, there is an even narrower gap between rendered and raw word counts on inner pages, which suggests they’re less likely to contain significant amounts of client-side rendered content.
Although the gap is narrower, it does follow the same pattern of the more words, the less they rely on client-side rendering.
Structured data
Structured data remains important for optimizing many sites. While it is not a ranking factor, per se, it often powers rich results, especially on Google.
These enhanced listings often make a site or elements of one stand out. Additionally, correctly implemented structured data can, for example, surface in other search engines.
The addition of inner pages in this year’s crawl is particularly relevant for structured data, since many types are only applicable to specific pages.
Home pages
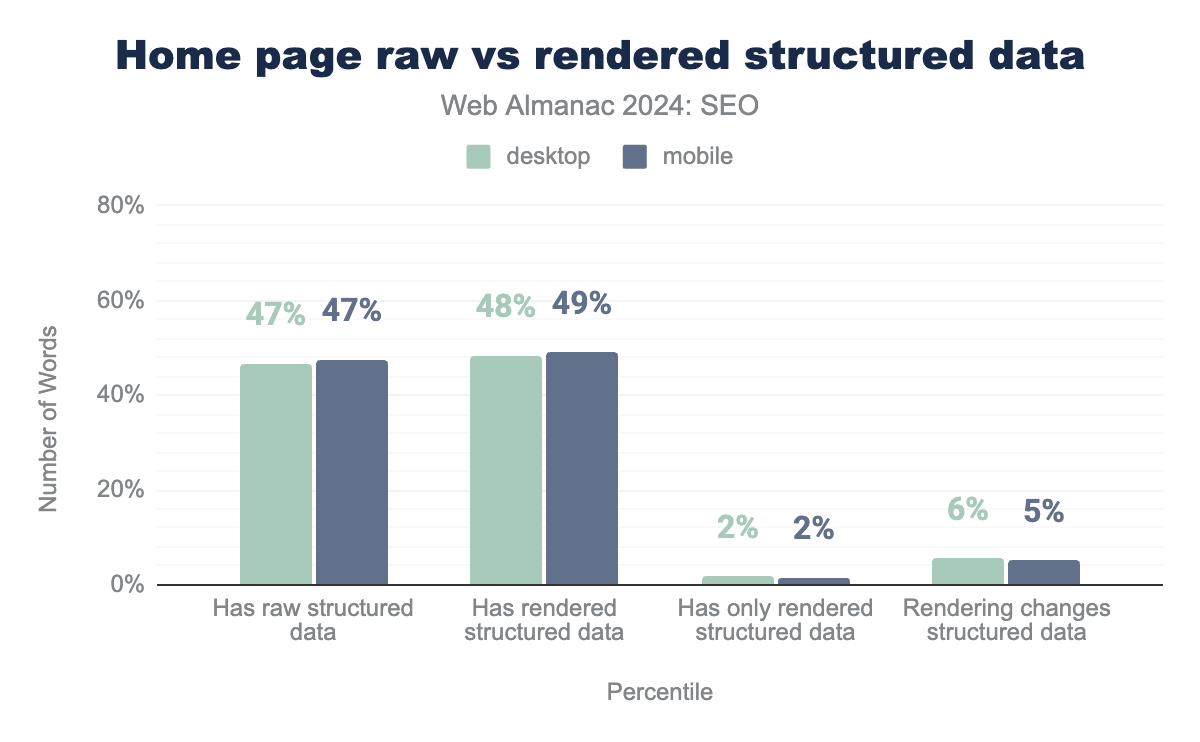
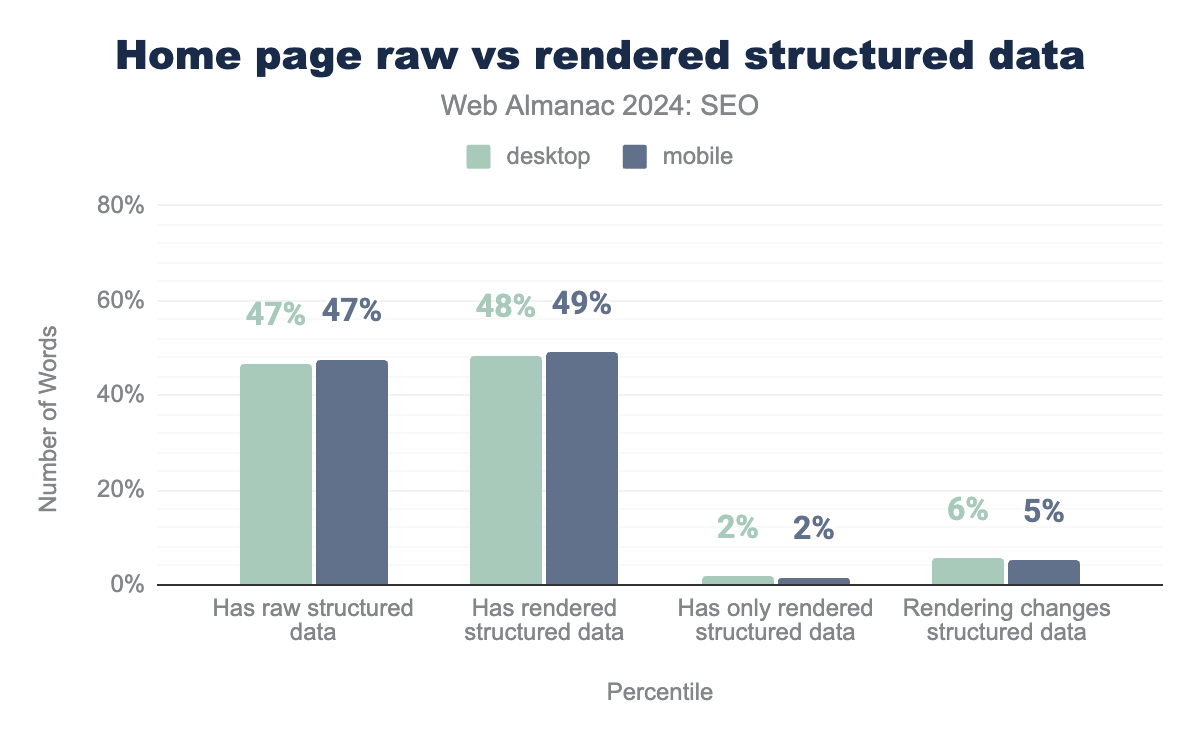
Overall usage of structured data grew in 2024 to 49% of mobile home pages and 48% of desktop home pages. This was a slight increase from 2022 when 47% of crawled mobile home pages and 46% of crawled desktop home pages had structured data.
The majority of sites provide structured data in the raw HTML, while only 2% of mobile and desktop crawls to home pages have structured data added via JavaScript.
A few more home pages, 5% of mobile and 6% of desktop crawls, contained some structured data that had been altered or augmented by JavaScript.
The trend appears to be that of providing structured data markup in the raw HTML, something Google itself highlights as, if not best practice, perhaps the simplest and most reliable way of implementing structured data.
Inner pages
Inner pages, such as product or event pages, are more likely to have structured data. In 2024, 53% of mobile and 51% of desktop inner pages had some structured data markup. And it dovetails with the fact that there are a number of Google developer documents that detail eligibility for rich results, based on structured data.
Overall, the trend of providing the markup in the raw HTML carries across from what was seen on home page crawls.
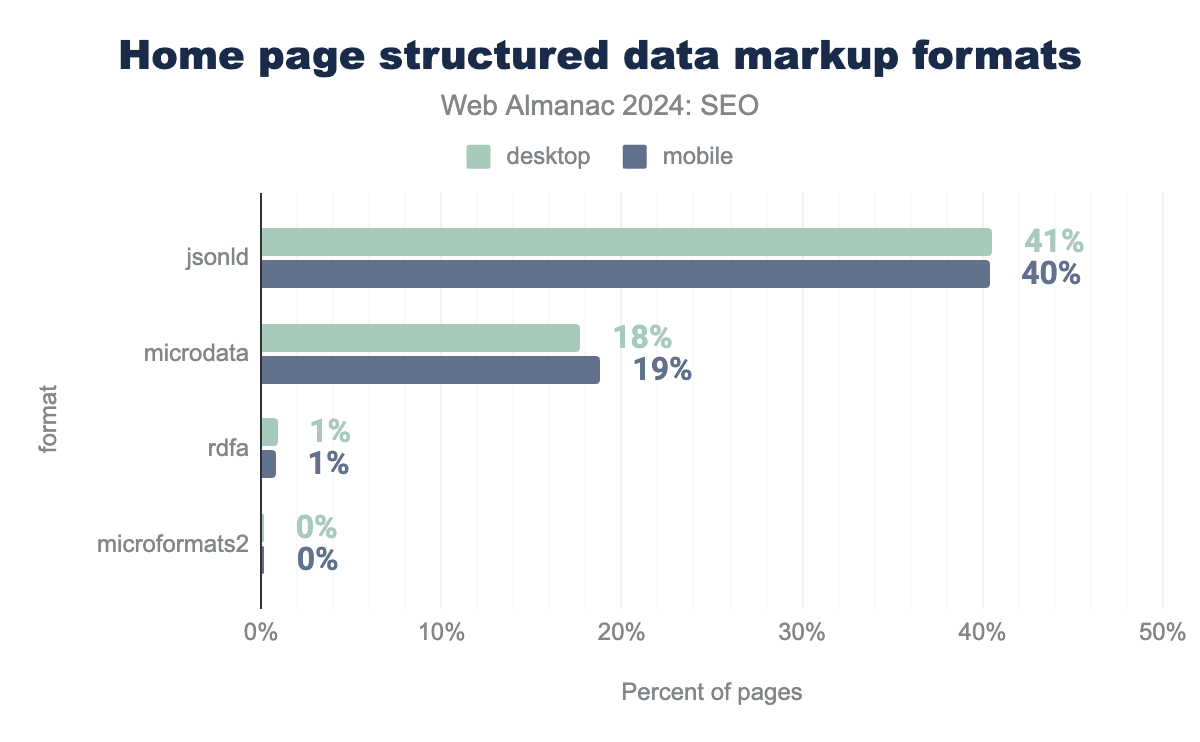
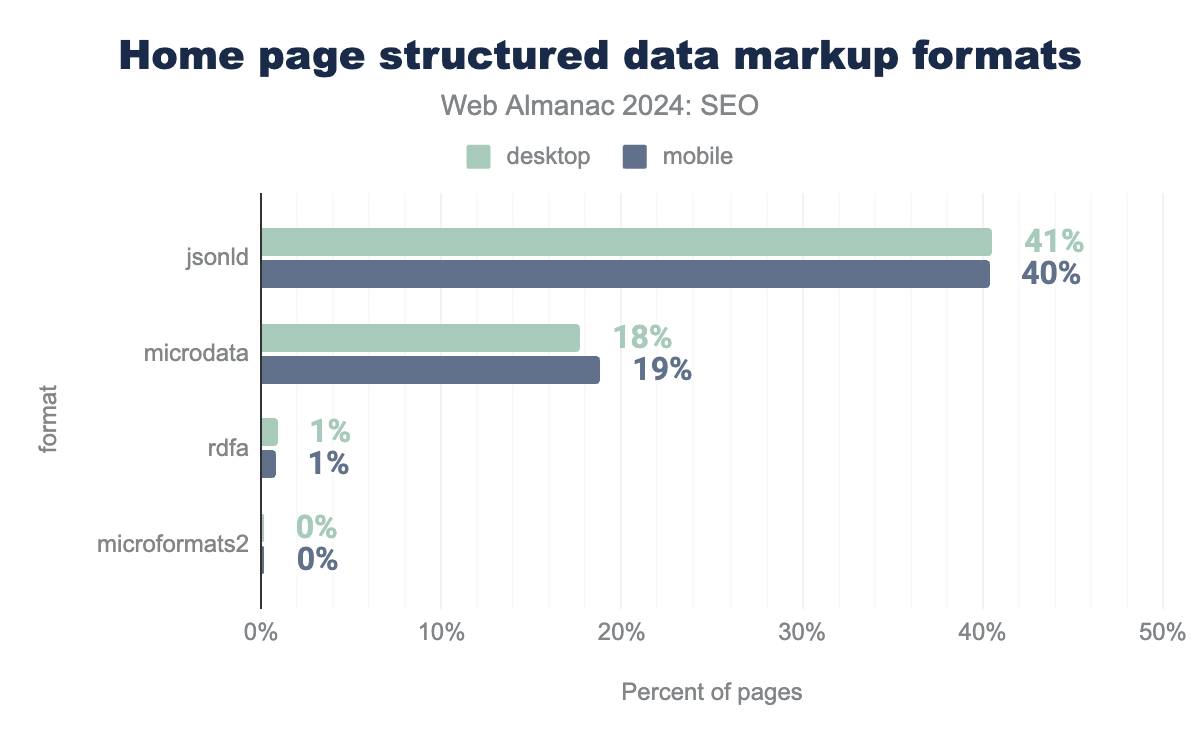
There are a number of different ways structured data can be implemented on a page, but JSON-LD is by far the most popular format for home pages. It accounts for 40% of mobile and 41% of desktop home pages crawled.
It’s simply the easiest format to implement, and is done by adding <script> elements that are independent of the HTML structure. Other formats, such as Microdata, involve adding attributes to the HTML elements of the page. Since Google advises using JSON-LD as a preferred format, it is not surprising that this is the most popular implementation.
For the most part, inner pages similarly utilize JSON-LD, but there is a slight increase in the use of structure data with Microdata for those pages.
Most popular home pages structured data types
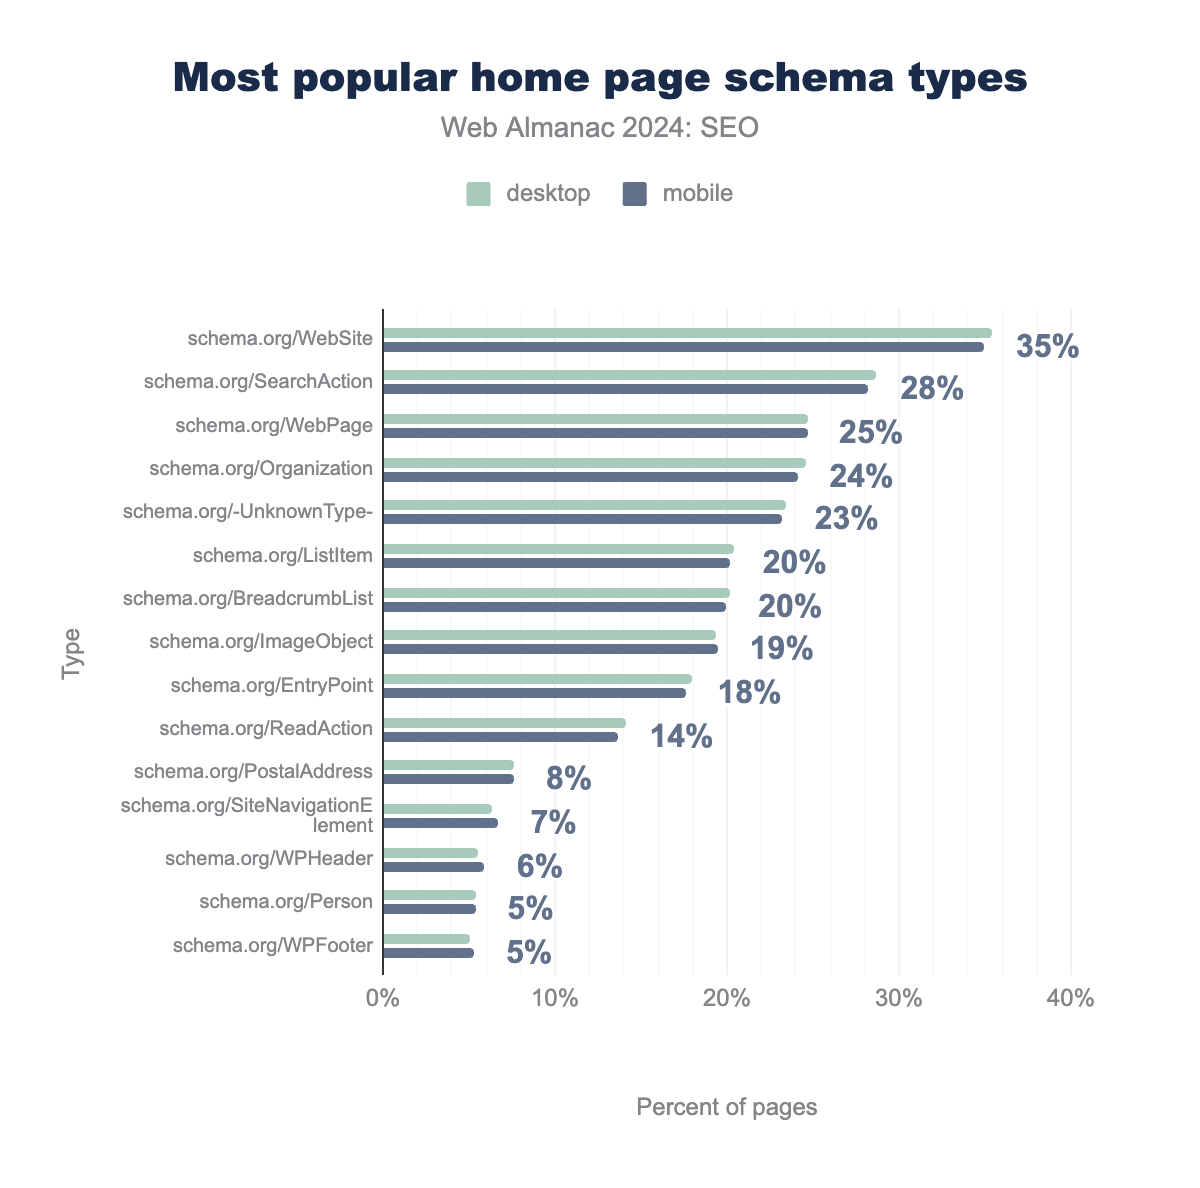
schema.org/WebSite was found on 35%, schema.org/SearchAction on 29%, schema.org/WebPage on 25%, schema.org/Organization on 25%, schema.org/-UnknownType- on 24%, schema.org/ListItem on 20%, schema.org/BreadcrumbList on 20%, schema.org/ImageObject on 19%, schema.org/EntryPoint on 18%, schema.org/ReadAction on 14%, schema.org/PostalAddress on 8%, schema.org/SiteNavigationElement on 6%, schema.org/WPHeader on 6%, schema.org/Person on 5%, schema.org/WPFooter on 5%. For mobile, they were found on 35%, 28%, 25%, 24%, 23%, 20%, 20%, 20%, 18%, 14%, 8%, 7%, 6%, 5%, and 5% of pages, respectively.Compared to 2022, there wasn’t a big shift in 2024 in terms of the popularity of structured data types found on home pages. WebSite, SearchAction, and WebPage remained the three most popular schema types since they power the Sitelinks Search Box on Google.
Interestingly, WebSite grew a little more in 2024 to 35% of mobile home pages from 30% in 2022 since Google recommends this as a way to influence a site name in the SERPs.
As for implementing the most popular schema types, there were minor differences between the percentages of mobile and desktop structured data usage.
Most popular inner pages structured data types
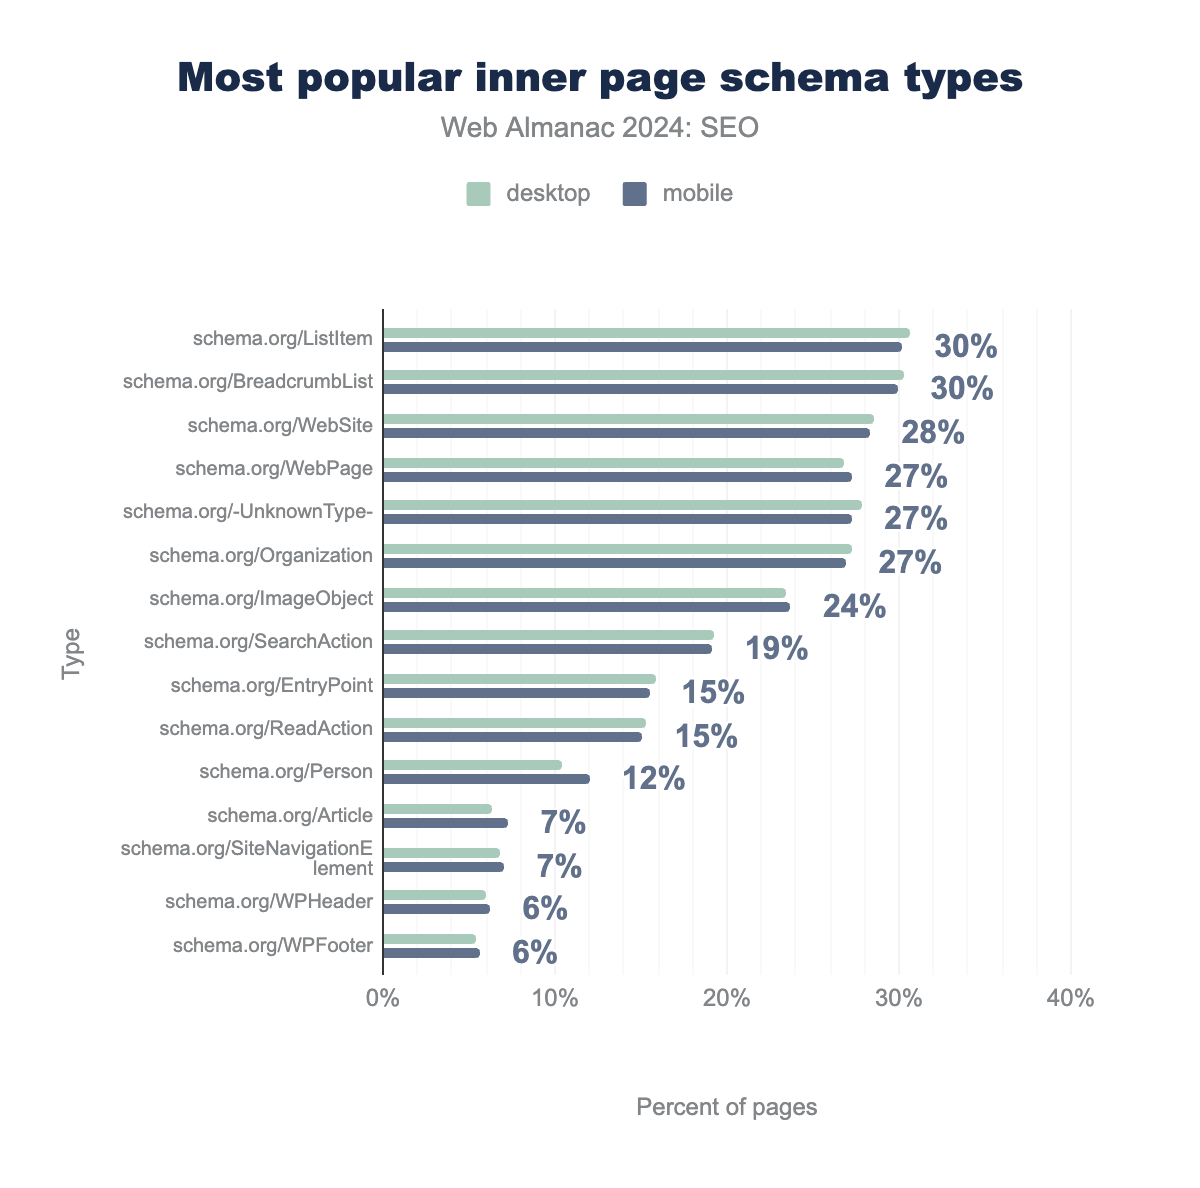
schema.org/ListItem was found on 31%, schema.org/BreadcrumbList on 30%, schema.org/WebSite on 29%, schema.org/WebPage on 27%, schema.org/-UnknownType- on 28%, schema.org/Organization on 27%, schema.org/ImageObject on 24%, schema.org/SearchAction on 19%, schema.org/EntryPoint on 16%, schema.org/ReadAction on 15%, schema.org/Person on 10%, schema.org/Article on 6%, schema.org/SiteNavigationElement on 7%, schema.org/WPHeader on 6%, schema.org/WPFooter on 5%. For mobile, they were found on 30%, 30%, 28%, 27%, 27%, 27%, 24%, 19%, 16%, 15%, 12%, 7%, 7%, 6% and 6% of pages, respectively.In terms of the inner pages, ListItem was the most popular schema type in 2024, representing 30% of mobile and 31% of desktop URLs. It stands to reason there would be more listing pages than “leaf” pages, such as product, event, or article pages (although Article schema was the 12th most popular type).
BreadcrumbList was the second most popular schema type. That was to be expected since one would be more likely to show a breadcrumb on an inner page.
What is surprising is that WebSite structured data, which is, at least for Google, home page specific, was the third most popular schema type on inner pages. A possible explanation is that particular structured data type is often implemented at a site template level and carried across the entire site.
Outside of the more popular schema types, product structured data was found on 4% of mobile pages and 5% of desktop pages.
For a deeper dive into structured data on the web, visit the Structured Data chapter.
AMP
Accelerated Mobile Pages, known mostly by the acronym AMP, is a framework for building pages, particularly mobile pages, that offer solid performance. Though designed for mobile pages, it is entirely possible to build a website for all devices using AMP.
It has been, however, a somewhat divisive technology, with many feeling the burden of maintaining a separate version of a page. Additionally, there are some limitations to AMP in performance with which publishers and site owners have grappled.
While it is not a direct ranking factor, in the past certain features, including Top Stories in Google, were reliant on, or at least influenced by, having an AMP version.
Home page usage
With the advent of Core Web Vitals (CWV), allowing the ability to quantify performance of non-AMP pages, the requirement for AMP to gain valuable real estate in search results, like Top Stories, has gone, as has much of the upside.
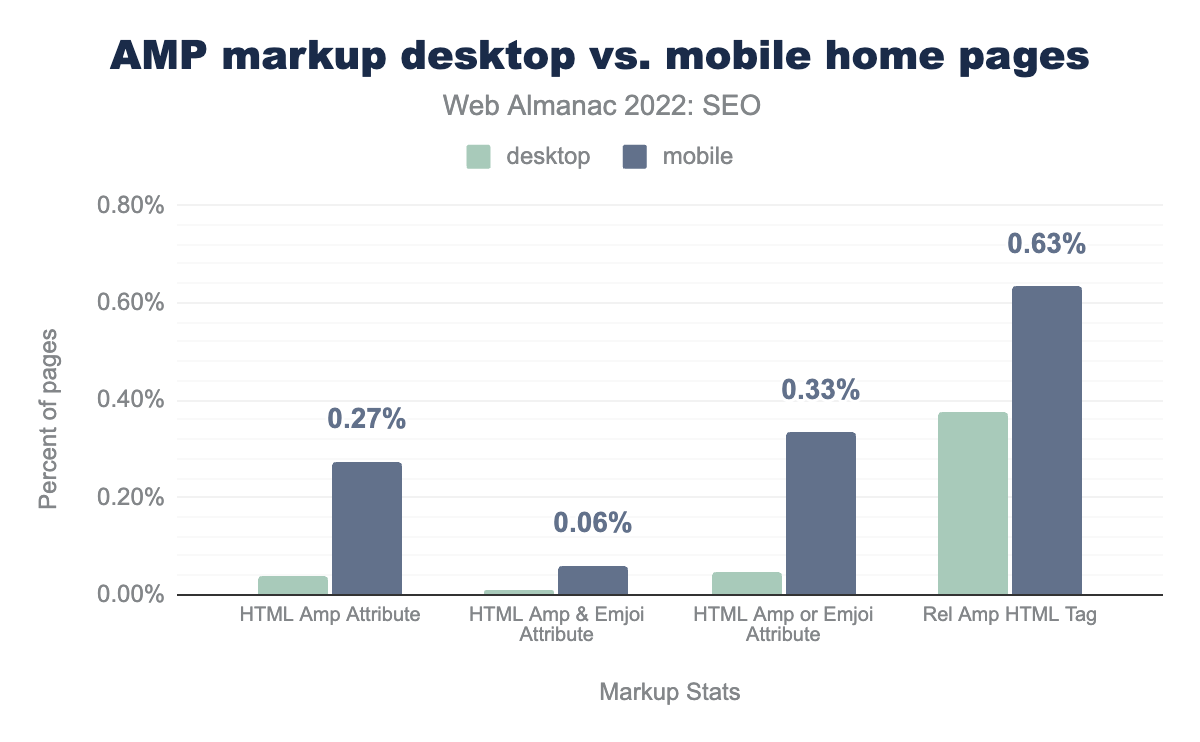
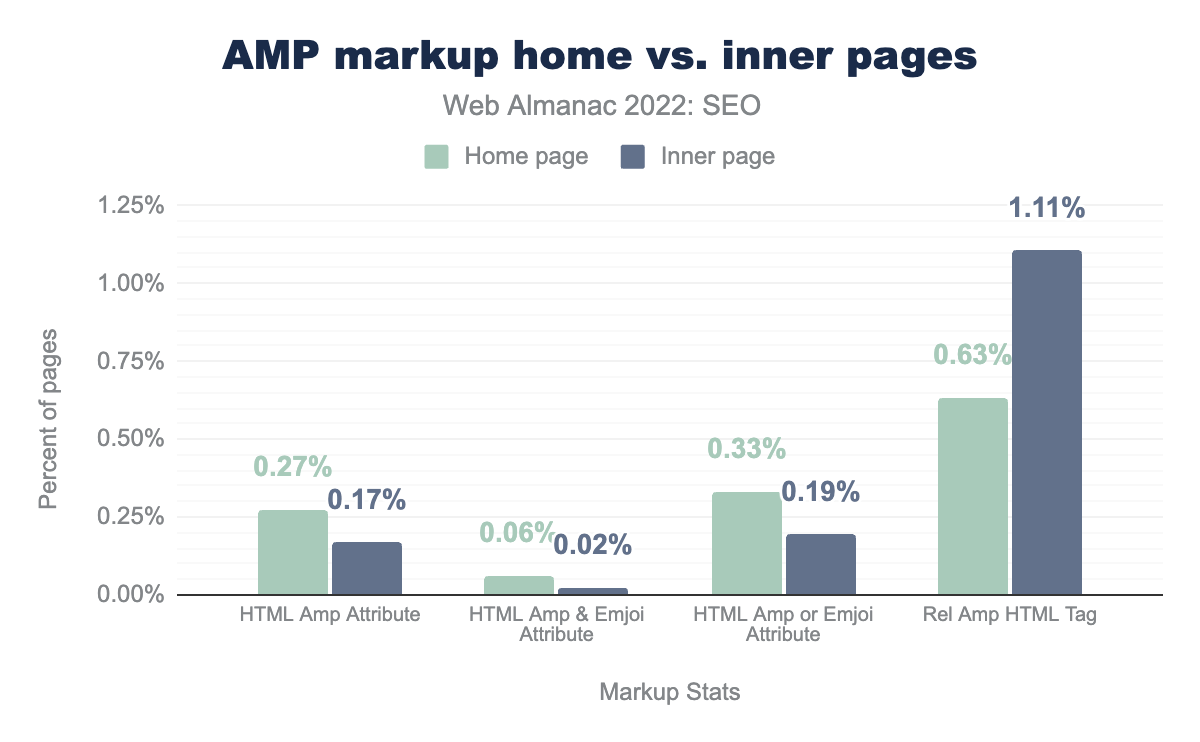
That’s why it’s a little surprising there was a slight uptick in the percentage of pages containing the amp html attribute. In 2024, it went up to 0.27% for mobile crawls compared to 0.19% in 2022. The desktop crawls, however, dropped to just 0.04%, down from 0.07% in 2022.
It’s worth noting these figures are relatively tiny, so the changes might not be statistically relevant, but they do point to low adoption of the technology.
Home pages vs. inner pages
Home pages are more likely when crawled to be AMP pages than inner pages, with 0.31% of home pages across mobile and desktop, and only 0.21% of inner pages having the HTML AMP attribute.
Internationalization
Internationalization is the process of optimizing a website to target multiple countries, languages, or regions, ensuring proper crawling and indexing by search engines. This involves employing best practices to deliver content to the correct audience.
Modern search engines like Google can determine a page’s language from its visible content. Additionally, they can detect the language used in navigation elements.
Still, it can be confusing for search engines to identify the appropriate language, such as when an English course is targeted at a German-speaking audience. In that case, while the page content would be in English, the target audience would be German speakers in different countries.
Therefore, the main purpose of internationalization mechanisms (via HTTP headers, HTML, or sitemaps), such as hreflang tags or content-language attributes, is to avoid confusion and help search engines deliver content to the correct audience.
hreflang implementation
hreflang tags help search engines understand what the main language is on a particular page. Its SEO application is that different countries or regions can be targeted using the appropriate language across different (though related) websites.
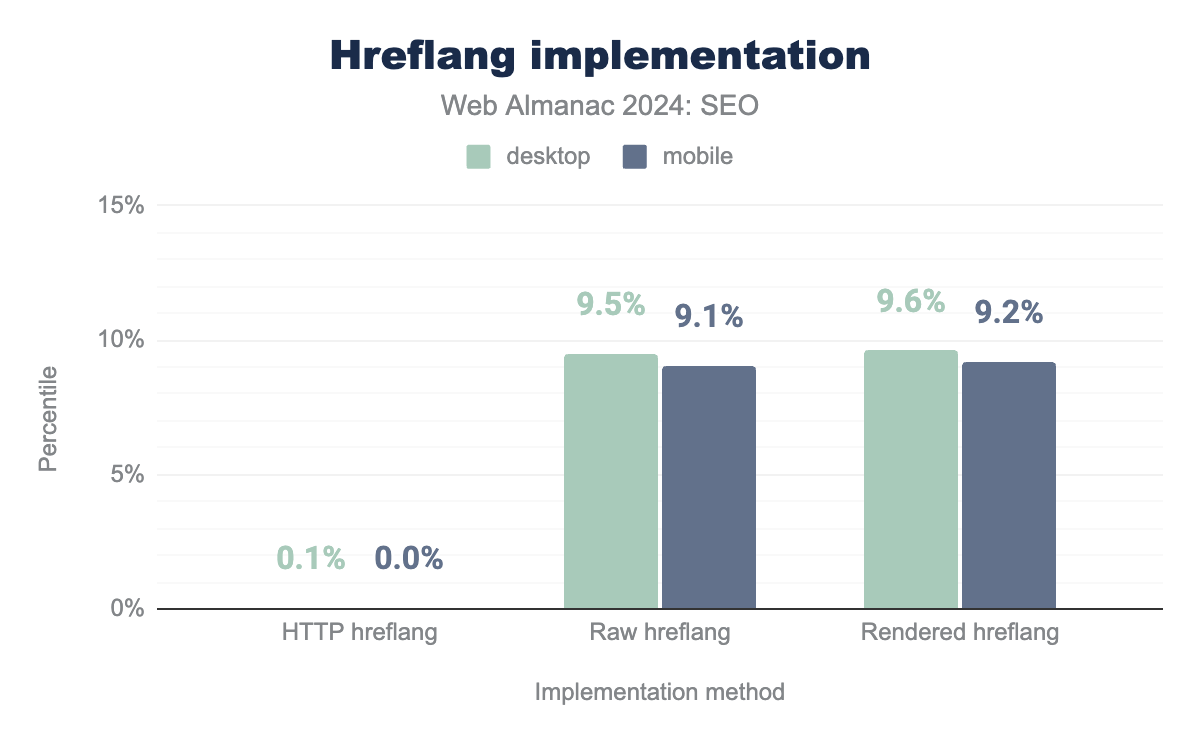
The analysis of hreflang tag implementation reveals that 0.1% of websites still use the HTTP protocol within their hreflang tags both on desktop and mobile. This indicates that a small portion of internationalized websites have not yet adopted the HTTPS standard.
As a result, the use of HTTP can cause an inconsistency that may confuse search engines in their correct interpretation of page content.
Furthermore, there’s a notable discrepancy between the raw and rendered versions of the tag. A difference of 0.1% exists on desktop (9.5% raw vs. 9.6% rendered) and 0.2% on mobile (9.1% raw vs. 9.2% rendered).
hreflang implementation on desktop and mobile sites. It shows HTTP hreflang: 0.1% (desktop) and 0.1% (mobile); Raw hreflang: 9.5% (desktop) and 9.1% (mobile); Rendered hreflang: 9.6% (desktop) and 9.2% (mobile)hreflang implementation.
The discrepancy between the “raw” and “rendered” versions of the hreflang tag indicates there are technical issues that are preventing the proper rendering of content, which affects how search engines interpret it.
Even when these discrepancies are considered minor, highly trafficked websites and/or those containing essential information for the public (such as from international institutions, research institutes, universities…) may experience significant losses in visibility with their intended audiences.
Home page hreflang Usage
While search engines can often detect a page’s language on its own, hreflang tags provide explicit signals to ensure content reaches its intended audience. These tags are typically used when a website has multiple language versions targeting different locales or regions.
Currently, 10% of desktop websites and 9% of mobile websites utilize hreflang. This represents a slight increase from 2022 when usage was 10% and 9% for desktop and mobile, respectively.
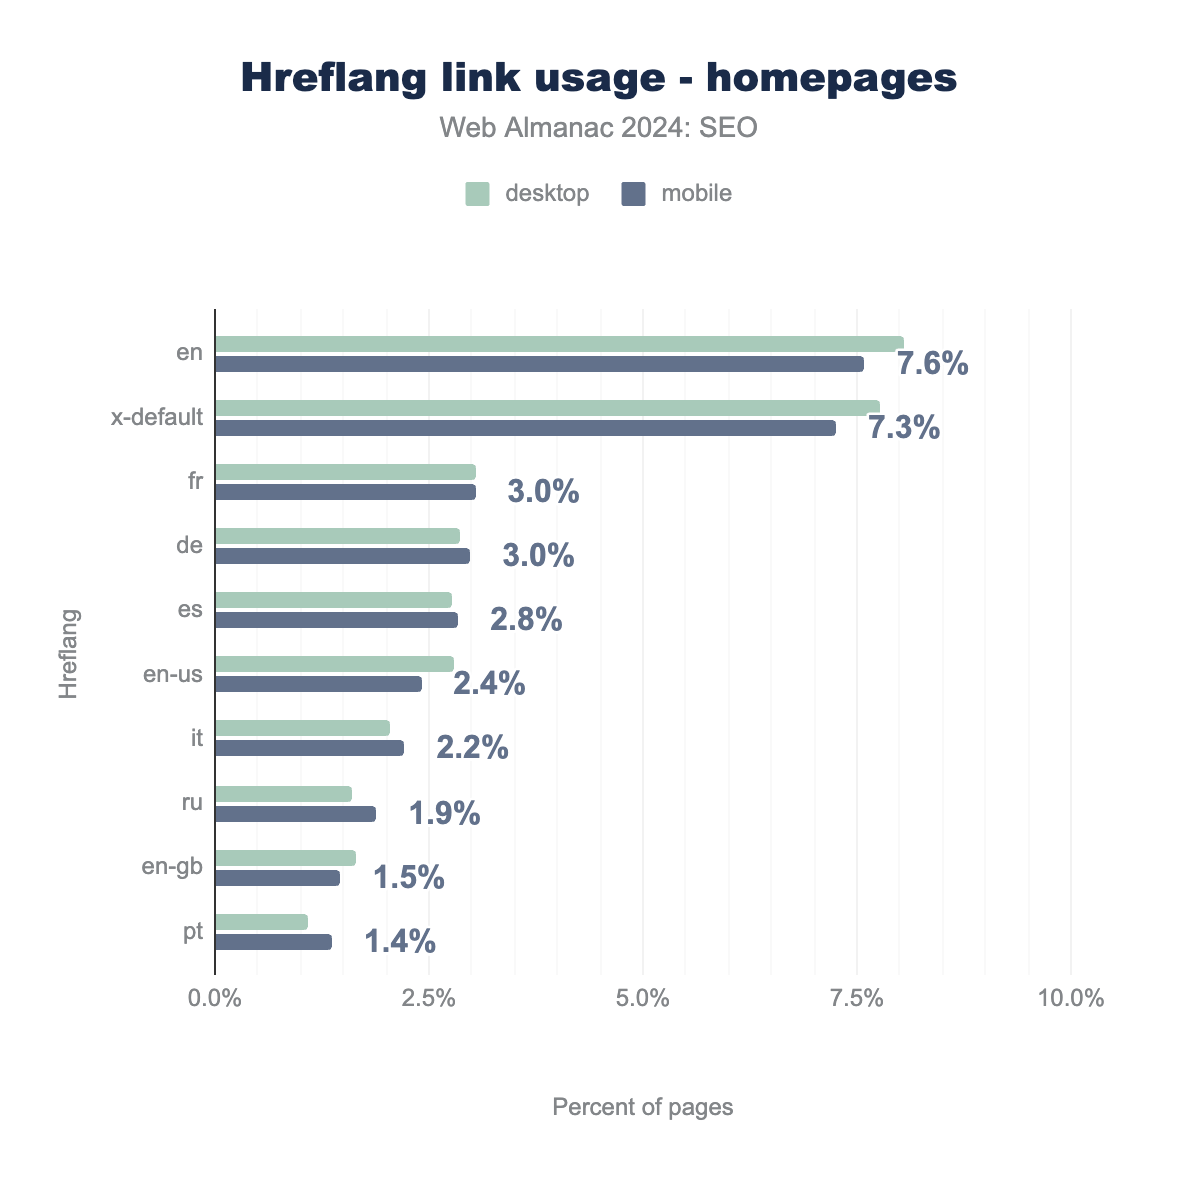
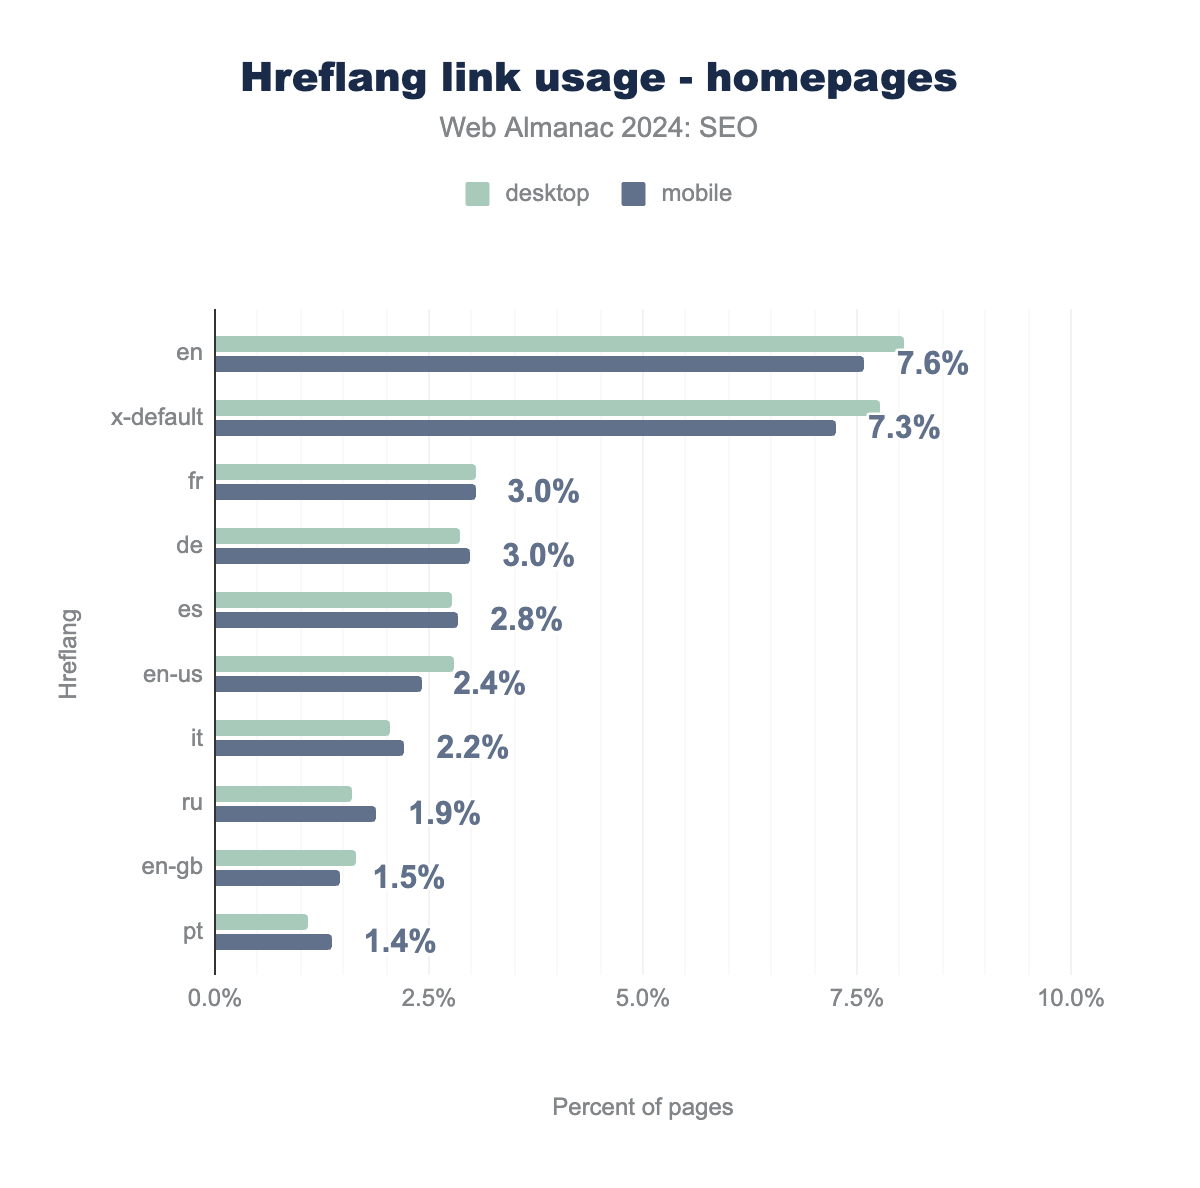
The most popular hreflang value in 2024 remained “en” (English), with 8% usage on desktop and 8% on mobile. That particular tag experienced considerable growth from 2022 when usage was 5% on desktop and 5% on mobile.
hreflang links on home pages, broken down by language code and platform (desktop vs. mobile). The total values for each tag are: en (7.6%), fr (3.0%), de (3.0%), es (2.8%), en-us (2.4%), it (2.2%), ru (1.9%), en-gb (1.5%), and pt (1.4%).hreflang link usage for home pages.
The most common variations of en are en-us (American English) at 2.8% (desktop) and 2.4% (mobile) and en-gb (British English) at 1.7% (desktop) and 1.5% (mobile).
Following en, the x-default tag, which specifies the default language version, is the next most popular tag. After that, fr (French), de (German), and es (Spanish) are the most frequently used hreflang values, which is similar to the findings in 2022.
Inner page hreflang usage
hreflang links usage on inner pages, broken down by language code and platform (desktop vs. mobile). The total values for each tag are: x-default (7.3%), en (7.1%), fr (3.0%), de (3.0%), es (2.8%), en-us (2.4%), it (2.2%), ru (1.9%), en-gb (1.4%), and pt (1.3%).hreflang link usage on inner pages
The use of hreflang tags on inner pages has x-default (7.3%) and en (English, 7.1%) as the most common values. When the values are broken down between mobile and desktop, we get 8.0% for desktop and 7.3% for mobile for x-default, and 8.0% for desktop and 7.1% for mobile for en.
Desktop usage is slightly higher than mobile for most hreflang values on inner pages. The differentials are quite small. With the exception of fr, the other hreflang values (de, es, en-us, it, ru, en-gb, pt) have usage below 3.0% and show a degree of concentration in the most common values.
As for distribution, the use of hreflang tags on inner pages is similar to that found on home pages. The x-default and en lead in adoption in both categories and underscores their global reach. Their percentages are lower on inner pages, which implies that hreflang implementation is generally prioritized on home pages.
Content language usage (HTML and HTTP header)
While search engines like Google and >Yandex only employ hreflang tags, others also use the content-language attribute, which can be implemented in two ways:
- HTM.
- HTTP Header
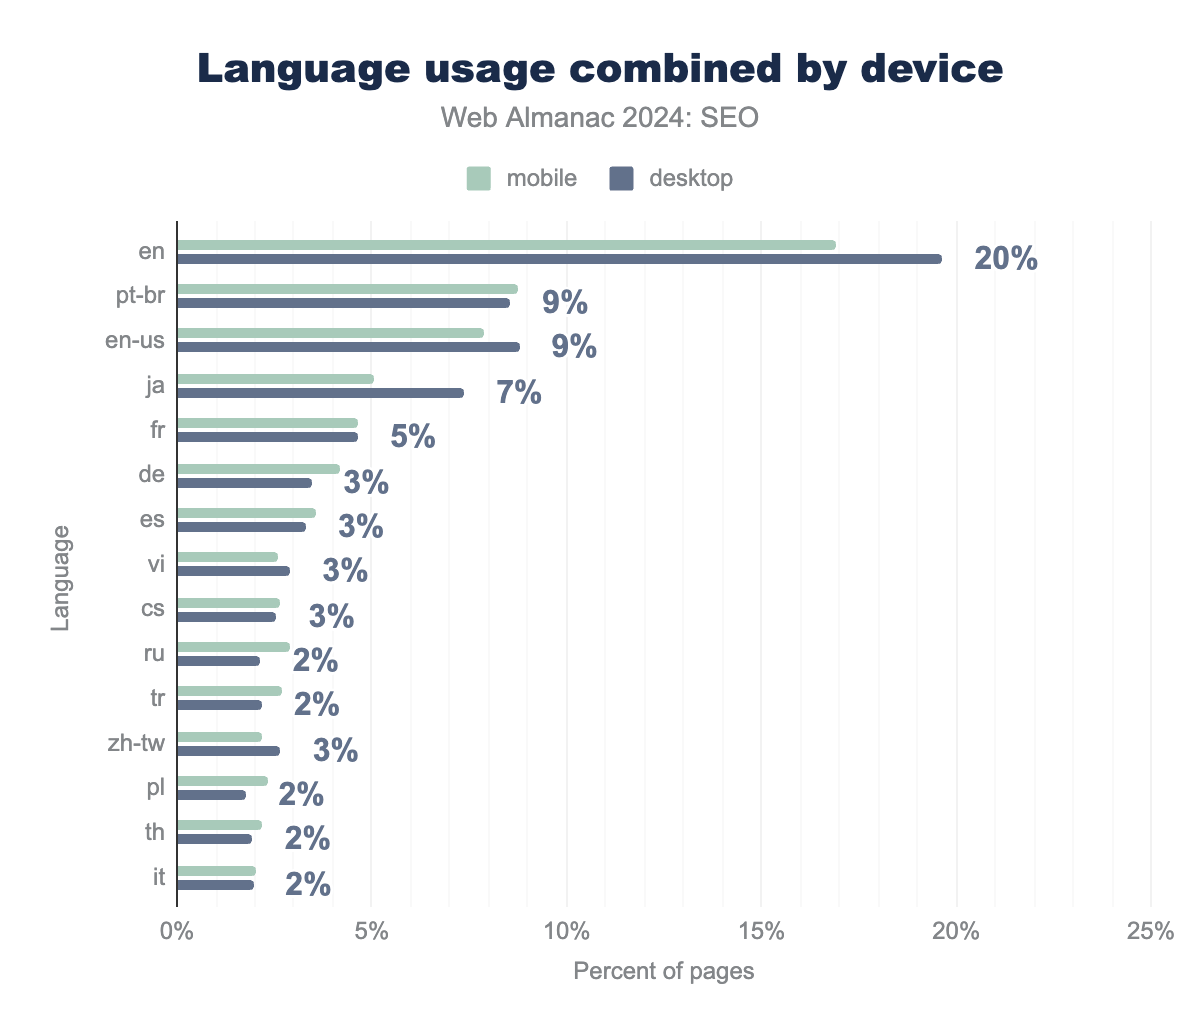
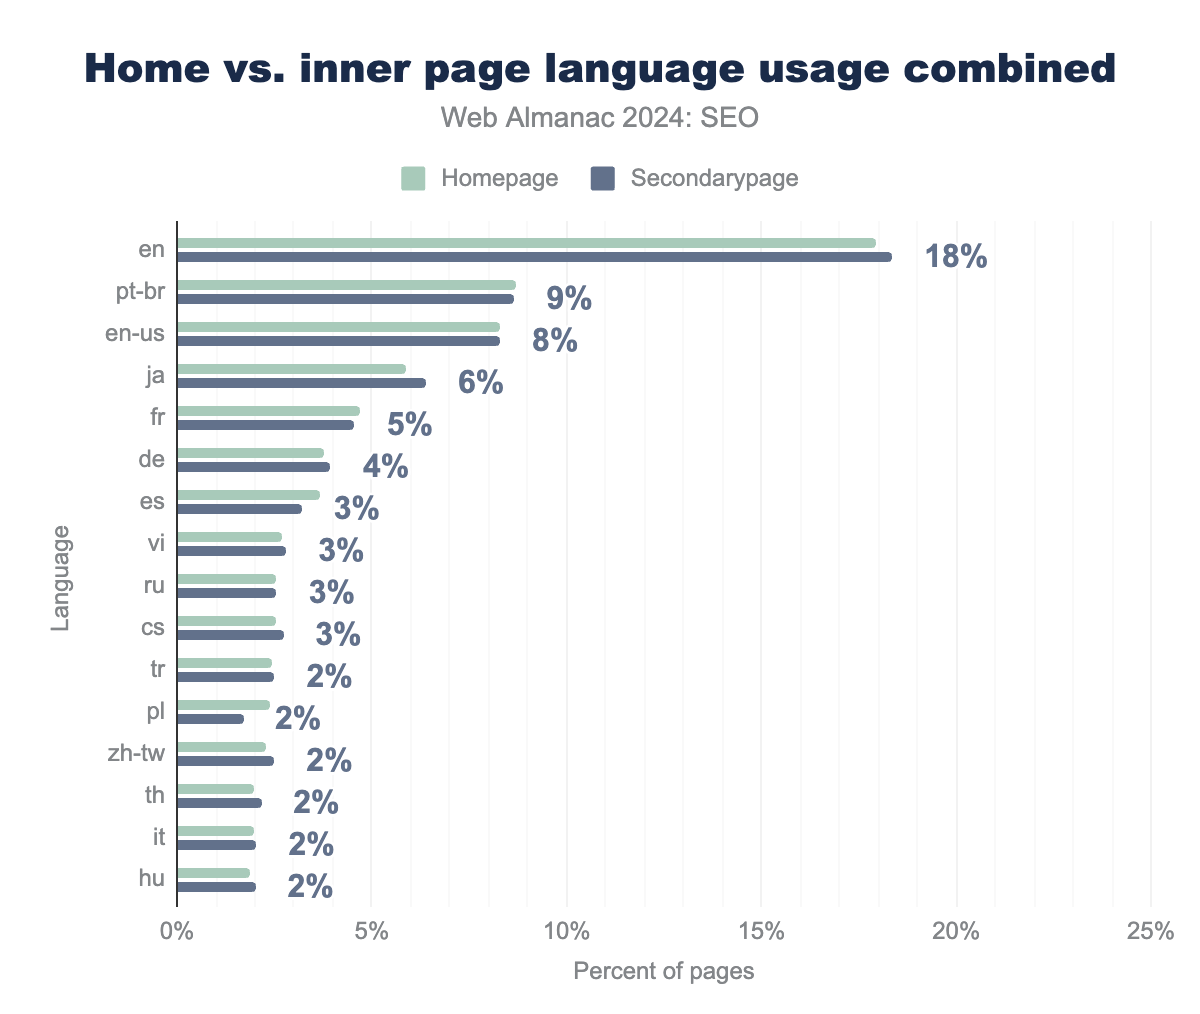
When examining language usage data for home pages and inner pages (the latter of which were not discussed in 2022), English (en) appeared as the main element (home page: 18% and inner page: 18%), followed by pt-br (home page: 9% and inner page: 9%), en-us (home page: 8% and inner page: 8%), and ja (home page: 6% and inner page: 6%).
Regarding other elements, the order followed almost the same pattern as the mobile and desktop comparison shown above.
When analyzing the resulting data for both graphs, the dominance of en suggests that a large proportion of content is still tailored to English speakers. The correlation appears to be a result of English not only being the most spoken language, but also widely used throughout global markets and a requisite for entrance to the powerful United States market (en-us).
Even though Mandarin is the second most spoken language in the world, the dominant search engine for this language, Baidu, does not require specific tags for locating Chinese websites. As a result, it presents a challenge when collecting data for the language. Still, zh-tw (the Chinese spoken in Taiwan) appears in the 13th position for language usage.
Additionally, the growth of pt-br from 6th position in the 2022 mobile versus desktop comparison to second position is quite significant and may indicate a pursuit of audience gains in this language.
Conclusions
The two years between the last Web Almanac SEO chapter in 2022 and this year’s edition may seem like a long time in SEO, which is often a fast-moving field. However, the data shows incremental changes to the fundamentals have been slow-moving.
The recent growth of the IndexIfEmbedded tag, for example, signals that perhaps certain practices and protocols need some time before there’s mass adoption within the SEO industry.
That said, it has not been business-as-usual. The amount of sites passing Core Web Vitals (CWV) has been tremendous, despite Interaction to Next Paint (INP) replacing the arguably much easier to pass metric of First Input Delay (FID). That positive news signals how performance, in general, is being taken more seriously in the SEO industry.
Most notably, AI and LLMs are presenting some of the biggest changes search engines have encountered in a long time, and they have the potential to be hugely disruptive. As a result, adoption of robots.txt, related to the associated crawlers, has already grown.
The ever-changing search landscape and the new opportunities afforded by AI and LLMs have the potential for SEO to quickly move into new areas. At the same time, the slow but steady improvements to fundamentals underscore that the state of SEO remains one where long-standing best practices, despite large sea changes, are both prized and ultimately rewarded.
