CMS

In this chapter, we interpret the evolving landscape of the Content Management System (CMS) and its increasing influence on how users experience content on the web. We aim to explore both the broader CMS ecosystem and the unique characteristics of web pages created through these platforms.
CMS platforms are pivotal in the collective effort to build a fast, resilient web. By examining their current state, asking critical questions, and identifying areas for future exploration, we can better understand their impact on web performance and user experience.
This year, we’ve approached the data with curiosity and expertise in several popular CMSs. We encourage you to view our analysis through the lens of CMS variability and the diverse types of content they support.
What is a CMS?
A Content Management System (CMS) is a tool that allows individuals and organizations to create, manage, and publish digital content, particularly on the web. A web-based CMS enables the seamless creation and management of websites while prioritizing user experience for both creators and visitors.
CMS platforms offer a variety of features for users to build websites, from user-friendly templates to more customizable options that require user input in the design and structure of the site. They also include administrative tools to simplify content management.
CMSs vary significantly in their approach to site creation. Some offer ready-made templates and drag-and-drop block builders, while others require users to design layouts and site structures. Regardless of approach, a CMS is supported by an ecosystem that typically includes hosting providers, extension developers, web agencies, and site builders.
In this chapter of the Web Almanac, we explore the entire ecosystem surrounding CMS platforms for 2023 and 2024, respectively. When we refer to a CMS, we mean the platform itself and the associated services and tools that form its ecosystem.
Based on Wappalyzer’s CMS definition, our dataset identifies 249 individual CMS platforms.
Some CMSs are open source, like WordPress and Joomla, while others are proprietary, such as Wix and Squarespace. These platforms offer hosting options, from free and self-hosted plans to premium, enterprise-level services.
The CMS landscape is a diverse and interconnected ecosystem, with platforms that differ in functionality, scale, and user experience.
CMS Adoption
Our analysis covers both desktop and mobile websites. While most URLs appeared in both datasets, some were accessed exclusively by desktop or mobile devices. We analyzed desktop and mobile results separately to account for these differences and avoid discrepancies.
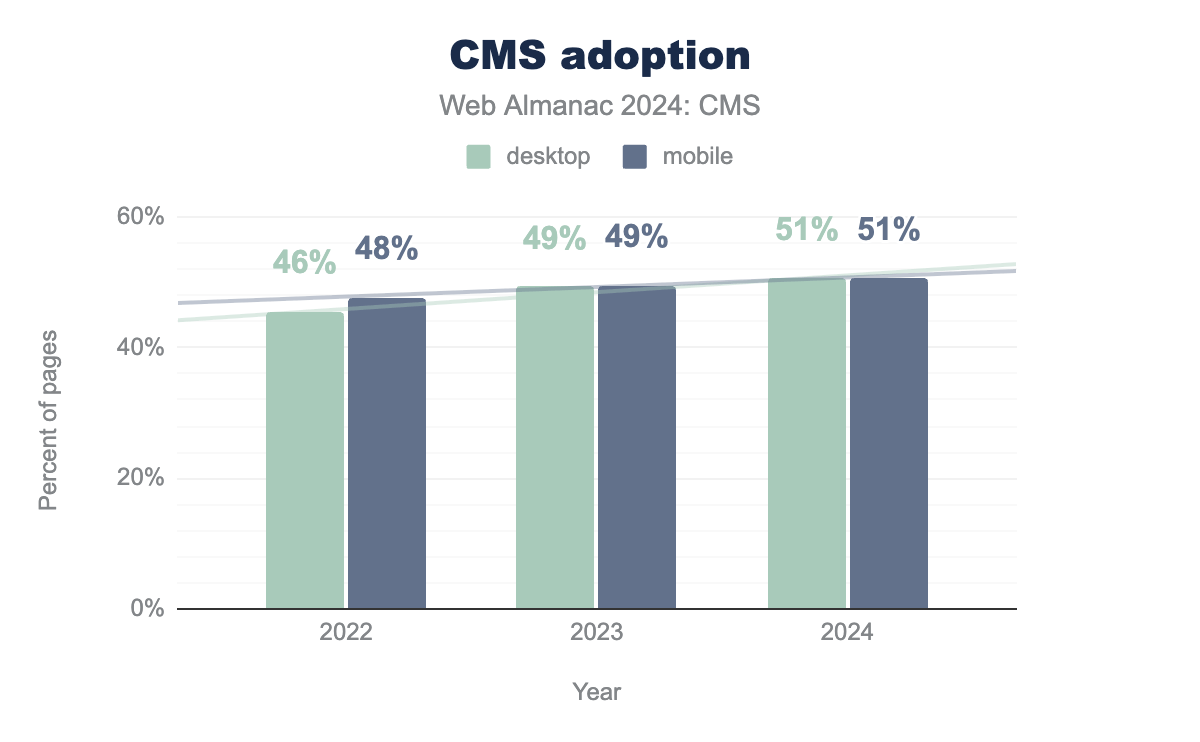
As of June 2024, 51% of the websites in the Web Almanac’s desktop dataset were powered by a CMS, a steady increase compared to 2022. The mobile dataset shows an increase from 48% in 2022 to 51% in 2024.
Looking closer at the raw desktop figures, we see a positive trend, with a clear bump registered in 2023. This is supported by data in both absolute and percentage terms, with the number of desktop URLs tracked by HTTP Archive (and the source CrUX dataset) growing from 5.4 million in July 2022 to 12.7 million in June 2024. The number of tracked mobile URLs, respectively, also reflects a booming growth in mobile device usage, with an increase of 8.6 million mobile URLs in the dataset for 2023 and a slight drop in 2024.
It’s important to note that our analysis differs from other commonly used datasets, such as W3Techs. These deviations are due to differing research methodologies and definitions of what qualifies as a CMS, which impact the final statistics.
For instance, as mentioned earlier, Wappalyzer uses a more strict definition of a CMS than we do, excluding some significant platforms that appear in W3Tech’s reports. You can learn more about our CMS criteria in the Methodology.
CMS adoption by geography
As of June 2024, CMS adoption worldwide has grown steadily, matching our dataset’s increased number of tracked URLs.
This year, unlike our analysis in 2022, we differentiate between countries and regions to offer better insights into geographical CMS usage.
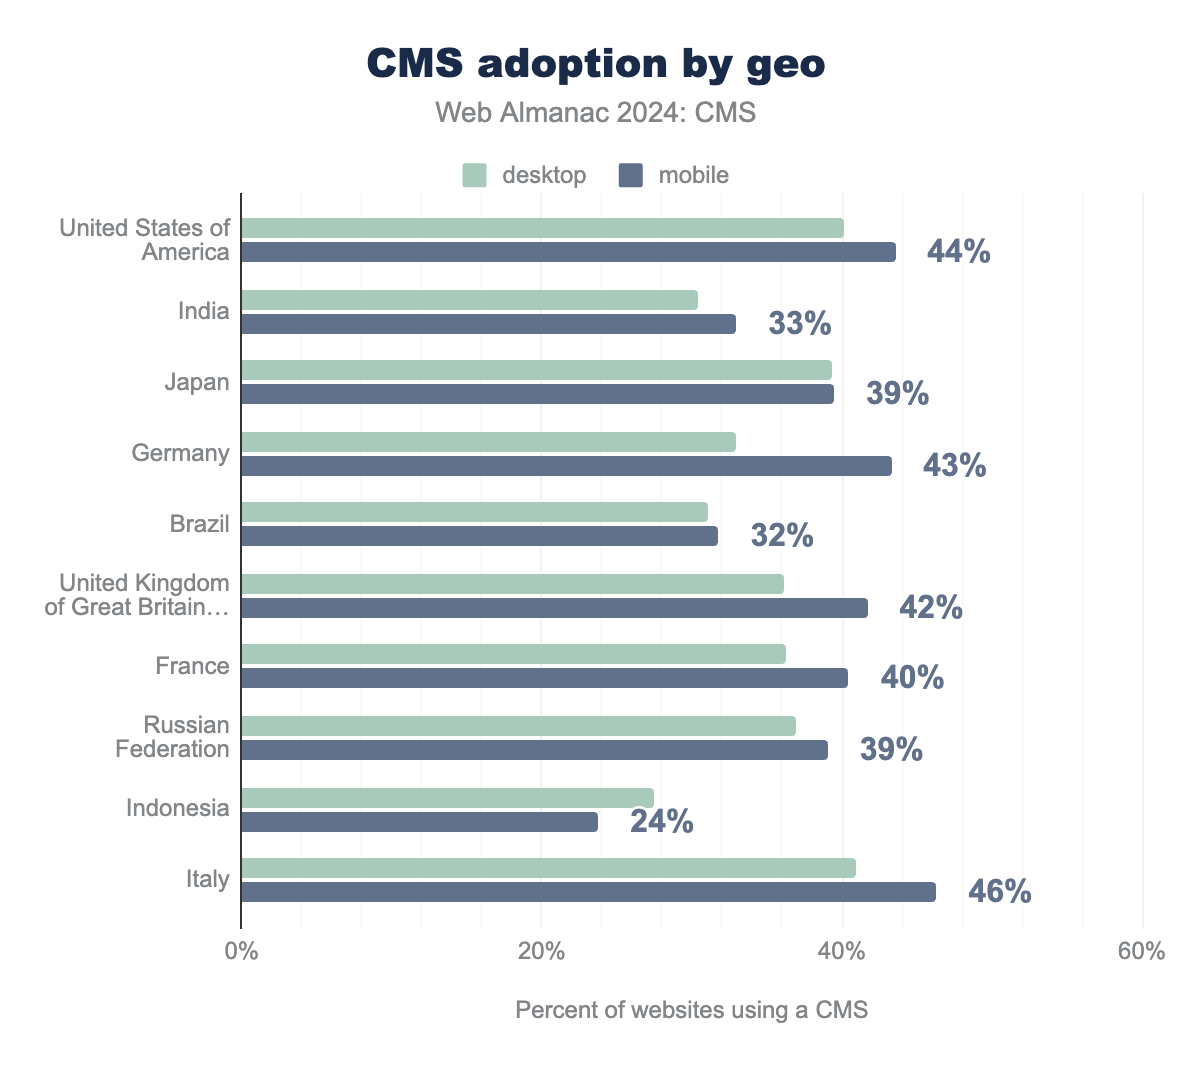
CMS adoption is highest in Italy and Spain, where 46% to 44% (40% to 41% in 2022) of mobile sites are built with a CMS. Brazil and Indonesia have the lowest adoption rates, with only 32% and 24%, respectively. Japan is seeing steady growth in mobile CMS adoption—39% in 2024 compared to 32% in 2022. Conversely, India shows a slight decrease in adoption (2% since June 2022). This can be attributed to the growing dataset and tracked URL increase, which helps us better understand the Indian web development market.
The year-over-year (YoY) analysis for mobile results shows consistent growth across countries, putting to rest some of our 2022 speculations for a wholesale drop in CMS adoption.
Let’s explore what the CMS adoption rate by region reveals.
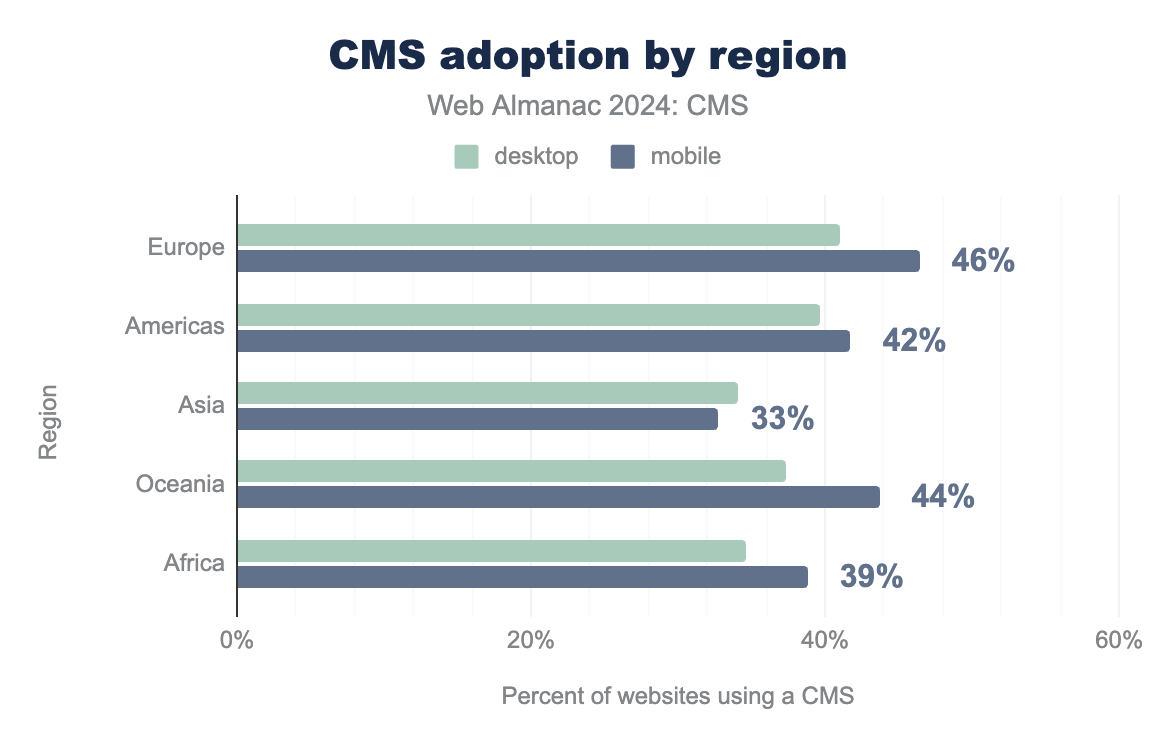
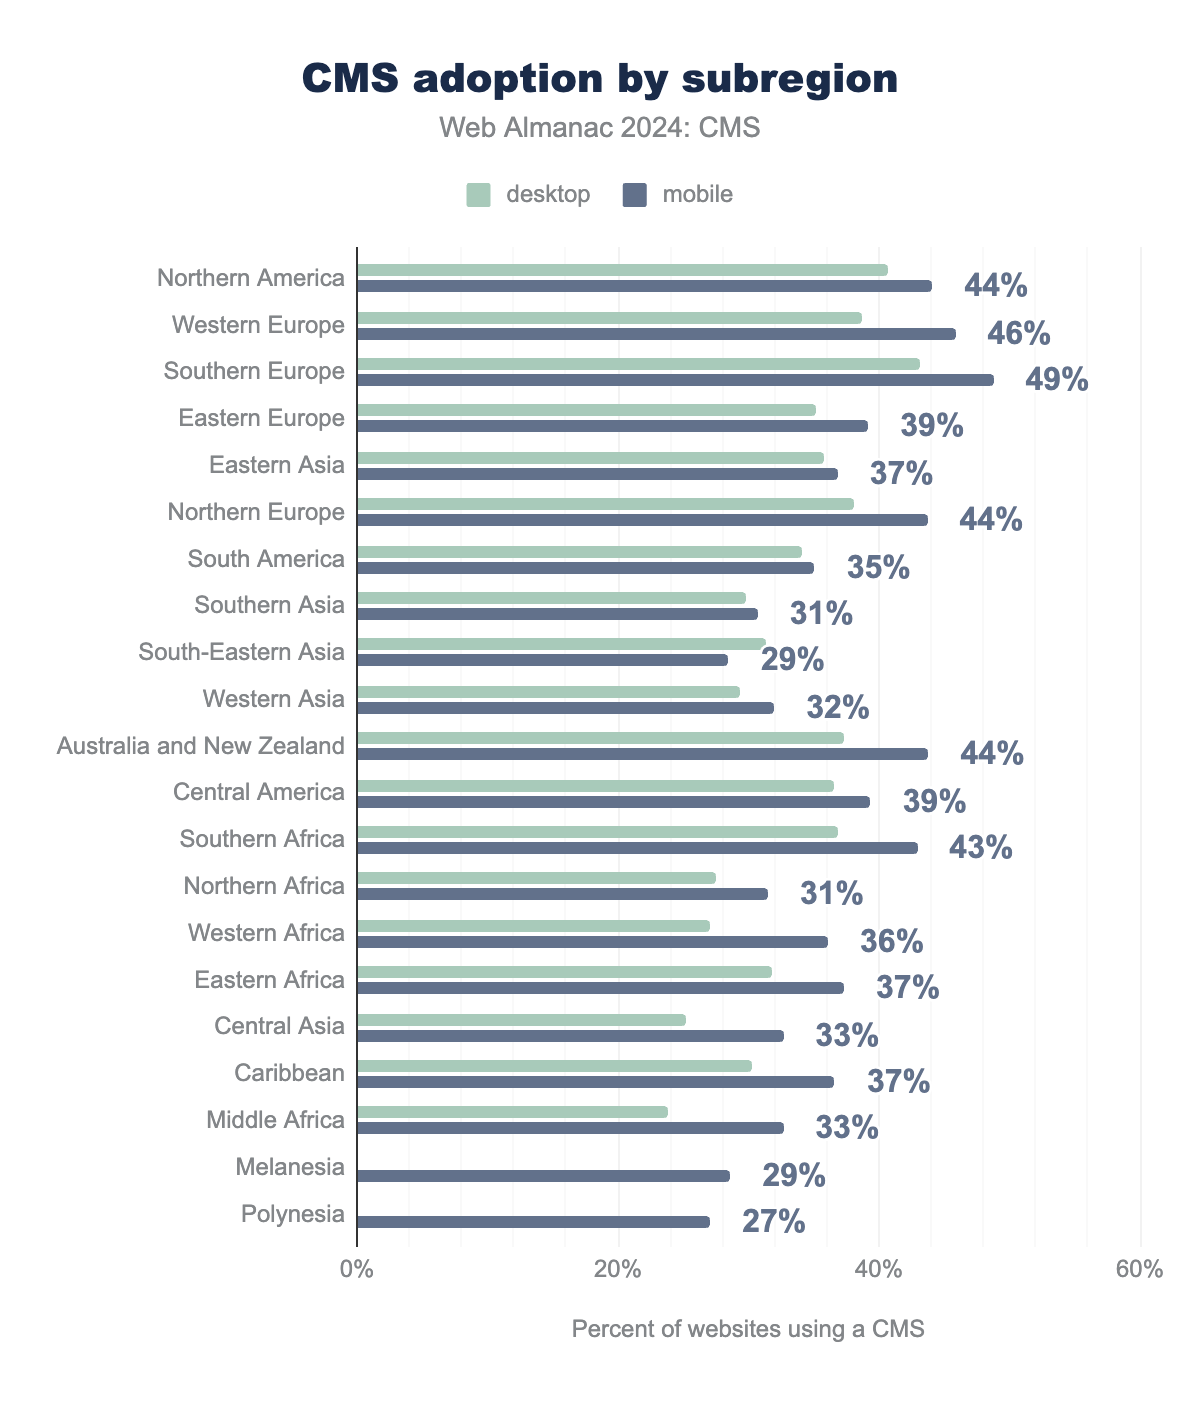
Following the trends in the country breakdown, Europe takes the lead with 46% for mobile results in CMS adoption rates. There are no discrepancies in the generated numbers followed by Oceania and the Americas. (44% and 42%, respectively.). It’s important to note that North America has a 44% rate of mobile CMS adoption across 1.5 million site pages, as shown in our CMS adoption by subregion graph below.
CMS adoption by rank
We examined CMS adoption by the estimated rank of the sites included within the dataset.
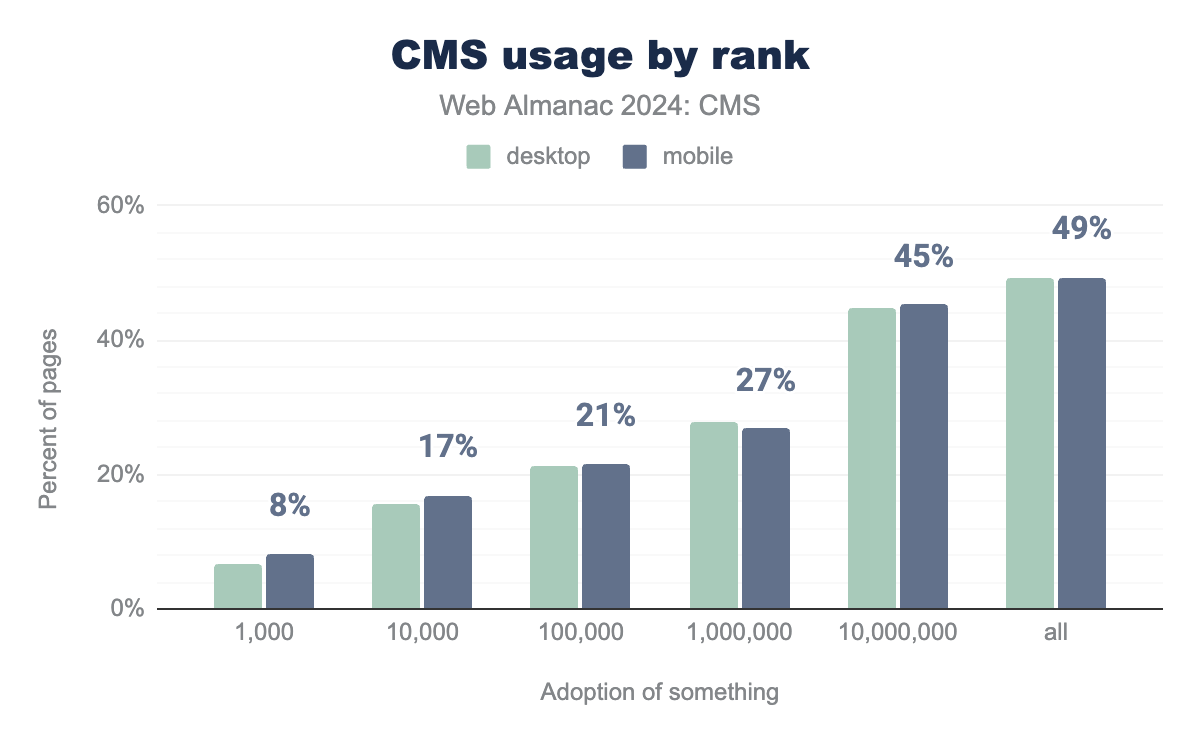
According to the dataset, CMSs are used by approximately 8% of the top 1,000 websites for both desktop and mobile, even though 49% of all mobile sites in the dataset use a CMS.
This has been an ongoing trend for the past few years, most likely attributed to business’s size relative to its web development needs. Smaller businesses (represented by a large chunk of our dataset here) tend to use popular CMSs for their affordability and usability. In these cases, it’s often easy to identify their CMS.
In contrast, larger businesses with higher-ranking websites often use custom-built CMS solutions that we can’t readily identify. They are also more likely to obfuscate the identity of their CMS. It is improbable that more than 90% of the top 1,000 would forgo a CMS entirely.It’s much more likely that they don’t appear in our dataset.
Top-ranking websites aside, this year, a significant CMS adoption decrease was observed across all rank groups. The total percentage of websites using a CMS dropped 15% from 39% in 2022, which we suspect is primarily due to the increased size of our dataset in 2024.
A potentially correlated trend is the adoption of “headless” CMSs and the move to separate content—and the CMS that powers it—from the frontend experience offered to end-users. Another plausible explanation is the smaller size of our dataset compared to the tracked URLs used for the YoY CMS adoption rate, where we observe consistent growth.
Most popular CMSs
Let’s look a little more into the top CMS’s.
Top 5 CMS adoption growth
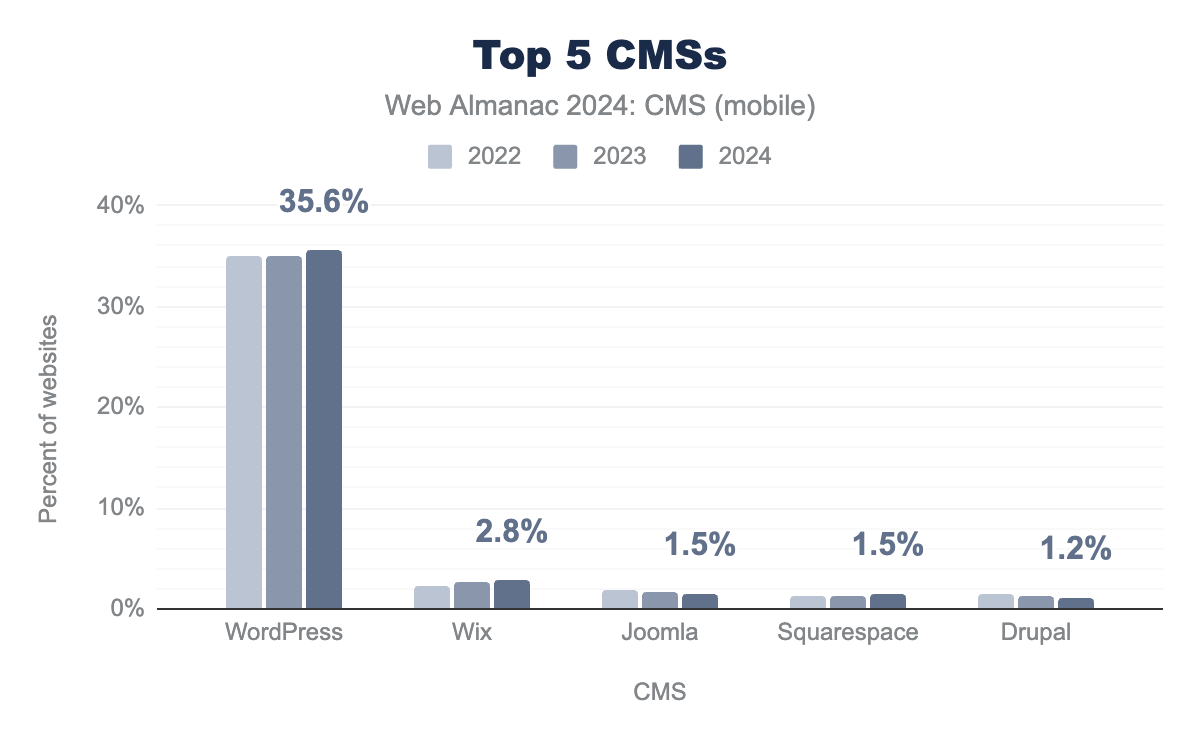
Among all websites that use an identifiable CMS, WordPress sites account for the majority of the relative market share—with over 35% adoption on mobile in 2024—followed by Wix (2.8%), Joomla (1.5%), Squarespace (1.5%), and Drupal (1.2%).
Comparing YoY, Drupal and Joomla continue to decline in market share while Squarespace and Wix grow (0.5% and 0.8%, respectively). WordPress continues its ascent, increasing 0.6% on mobile over 2023-2024 This represents a slower pace of growth than in previous years.
CMS user experience
With the introduction of Core Web Vitals four years ago, user experience has become a priority. That said, while users were mainly comparing CMS platforms based on ease of use, number of plugins/extensions, and themes available, they added one additional criterion—the default user experience offered by a particular platform.
To examine these experiences, we gathered data from the Chrome User Experience Report (CrUX) and interrogated three specific metrics:
- Core Web Vitals
- Lighthouse scores
- Resource weights
Core Web Vitals
Google’s Core Web Vitals are a set of three user-centric performance metrics that measure critical aspects of user experience, focusing on loading speed, interactivity, and visual stability:
- Largest Contentful Paint (loading)
- Interaction to Next Paint (interactivity)
- Cumulative Layout Shift (visual stability)
Since their introduction in 2020 and becoming a ranking signal in 2021, CWV are now recognized as essential to delivering a good user experience across the web.
If you’re interested in how websites perform against the Core Web Vitals on a larger scale, the Performance chapter covers this topic in greater detail.
In this section, we are interested in looking at the Core Web Vitals specifically in the context of CMS platforms.
There are 200+ known CMS platforms, but we narrowed our list to the top 10 most used CMSs, considering they have more than 85% market share. We used the Core Web Vitals Technology Report, which provides a global overview of how different technologies perform in relation to Google’s Core Web Vitals.
Below is the percentage of sites on each platform that score “good” (LCP under 2.5s; INP under 200ms; CLS below 0.1) for all three Core Web Vitals:
We decided to focus primarily on mobile results for three reasons:
- As of July 2024, mobile has a 68.29% global traffic share
- Mobile devices have resource and connectivity limitations, which paint a more realistic picture of how everyday users experience the web
- All CMS platforms, and technologies in general, score better on desktop
Putting that aside, we can see that all 10 CMS platforms improved their Core Web Vitals, with Squarespace leading the board with a whopping 28% YoY improvement. The top 3 include Wix with 18% and 1C-Bitrix with 14%. The list then goes as follows: WordPress (11% YoY), Tilda (11% YoY), Duda (11% YoY), Drupal (10% YoY), and Weebly (10% YoY). At the bottom are TYPO3 CMS with 9% and Joomla with 8%.
These YoY improvements are as remarkable as the overall Core Web Vitals pass rate the top 10 CMSs collectively provide. For reference, the global CWV pass rate for all origins as of June 2024 is 51%.
Having platforms like Duda, TYPO3 CMS, and Squarespace with results way north of that is a testament to the efforts these platforms have put into enhancing user experience.
Now, let’s drill into the three Core Web Vitals to see where each platform can improve and which metrics improved the most since 2023.
Largest Contentful Paint (LCP)
Largest Contentful Paint measures how long it takes for the largest above-the-fold element to load on a page. Anything under 2.5 seconds is considered a “good” LCP score.
This metric represents how quickly users can see what is likely the most meaningful content on a web page.
Of the three Core Web Vitals, LCP is the hardest to optimize. That’s why LCP pass rates are the lowest and LCP is considered the bottleneck to passing CWVs.
The reason why LCP is such a challenging metric is that there are a lot of moving parts when it comes to its optimization. You need to:
- Ensure the LCP resource starts loading as early as possible.
- Ensure the LCP element can be rendered as soon as its resource finishes loading.
- Reduce the load time of the LCP resource as much as you can without sacrificing quality.
- Deliver the initial HTML document as fast as possible.
However, the top 10 CMSs showed some impressive results when it comes to their YoY LCP improvements and overall scores:
Before diving into the YoY stats, take note that the global LCP pass rate (as of June 2024) is 63.4%. As you can see from the graph, more than half of the platforms achieve better results.
Considering how much they have improved since 2023, Squarespace is again ahead of the other CMSs with a YoY improvement of 27%. Wix is in second place with 13%, and WordPress is third with 11%. The remaining platforms improved by less than 10%.
Cumulative Layout Shift (CLS)
Cumulative Layout Shift (CLS) is a metric used to measure layout stability. It reflects how much content unexpectedly shifts on the screen.
A website is considered to have good CLS if at least 75% of all site visits score 0.1 or lower.
Comparing yearly data shows that the CLS results aren’t as impressive as the LCP or the overall CWV pass rates. Most platforms made little progress, while Duda, Wix, and Weebly struggled to improve their 2023 results.
Interaction to Next Paint (INP)
After being announced in 2023 and in an experimental phase for the rest of the year, Interaction to Next Paint officially replaced First Input Delay (FID) as the new interactivity Core Web Vitals metric on March 12, 2024.
INP assesses a page’s responsiveness to user interactions by observing the latency of all qualifying interactions during a user’s visit to a page. The final INP value is the longest interaction observed.
Simply put, the newest Core Web Vital measures the time from the interaction (for example, a mouse click) until the browser can update (or paint) the screen.
An INP below or at 200 milliseconds means a page has good responsiveness.
Considering the whole interaction latency, including input delay, processing time, and presentation delay, the introduction of INP led to a global drop in the Core Web Vitals pass rate.
That said, the YoY improvement and overall CWV pass rate demonstrated by the top 10 CMSs is even more impressive, considering the big changes INP introduced.
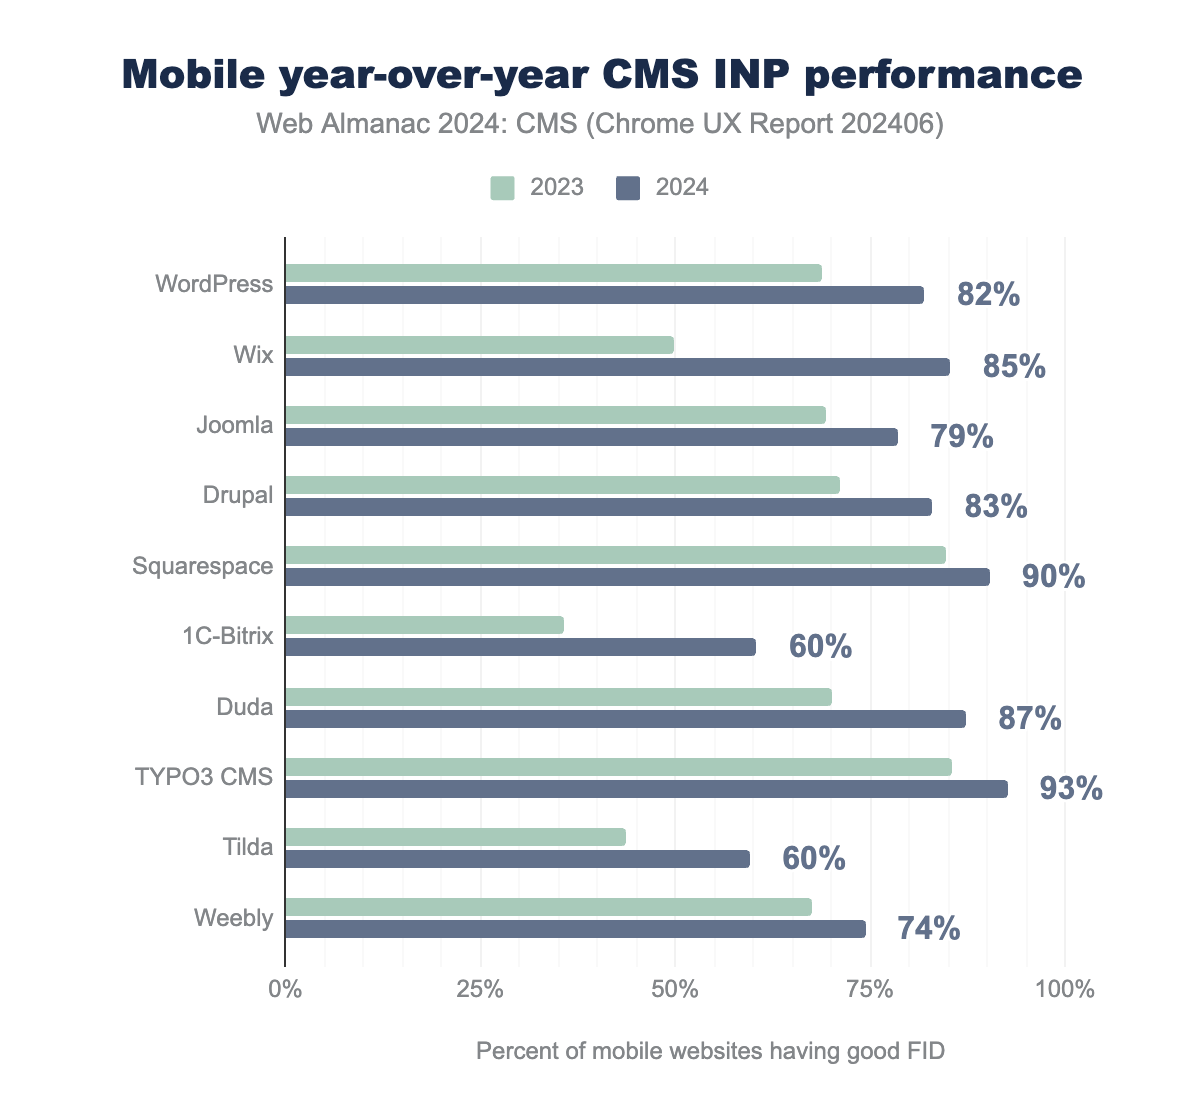
When it comes to their INP score, the majority of platforms achieve a pass rate of 80% or above:
The CMSs that fail to pass include Tilda and 1C-Bitrix, which, despite the YoY improvement, still struggle to achieve the global standard of 84.1%.
The Deprecation of FID
First Input Delay is no longer a Core Web Vitals metric. Furthermore, Chrome officially deprecated support for FID on September 9, 2024.
The primary reasons for INP replacing FID include the scope of measurement and comprehensiveness.
Looking at the Web Almanac’s previous editions we can see that all websites had a good FID score on desktop, and nearly all on mobile. This data should indicate that visitors rarely experience a laggy website.
Unfortunately, the reality is that the web often does have a responsiveness problem. And FID was no longer accurately measuring it.
The issue with FID was that it only measured the delay for the first input, ignoring the processing time and presentation delay and failing to capture the page’s responsiveness throughout the user’s entire session.
In contrast, INP evaluates the responsiveness of the entire page throughout the user’s session, providing a more comprehensive and accurate representation of the user experience.
Lighthouse
Lighthouse is an open-source, automated tool designed to improve the quality of web pages by providing a set of audits that evaluate websites based on 4 categories:
- Performance
- Accessibility
- SEO
- Best Practices
Lighthouse generates reports with lab data that offer developers actionable suggestions for enhancing website performance. However, it’s important to note that Lighthouse scores do not directly impact the real-world field data collected by CrUX. You can further explore how Lighthouse lab scores and field data differ.
The HTTP Archive runs Lighthouse on mobile and desktop web pages, simulating a slow 4G connection with throttled CPU performance for mobile.
By analyzing this data, we can gain a different perspective on CMS performance through synthetic tests, which also capture metrics not monitored by CrUX.
Performance score
The Lighthouse performance score is a weighted average of several scored metrics.
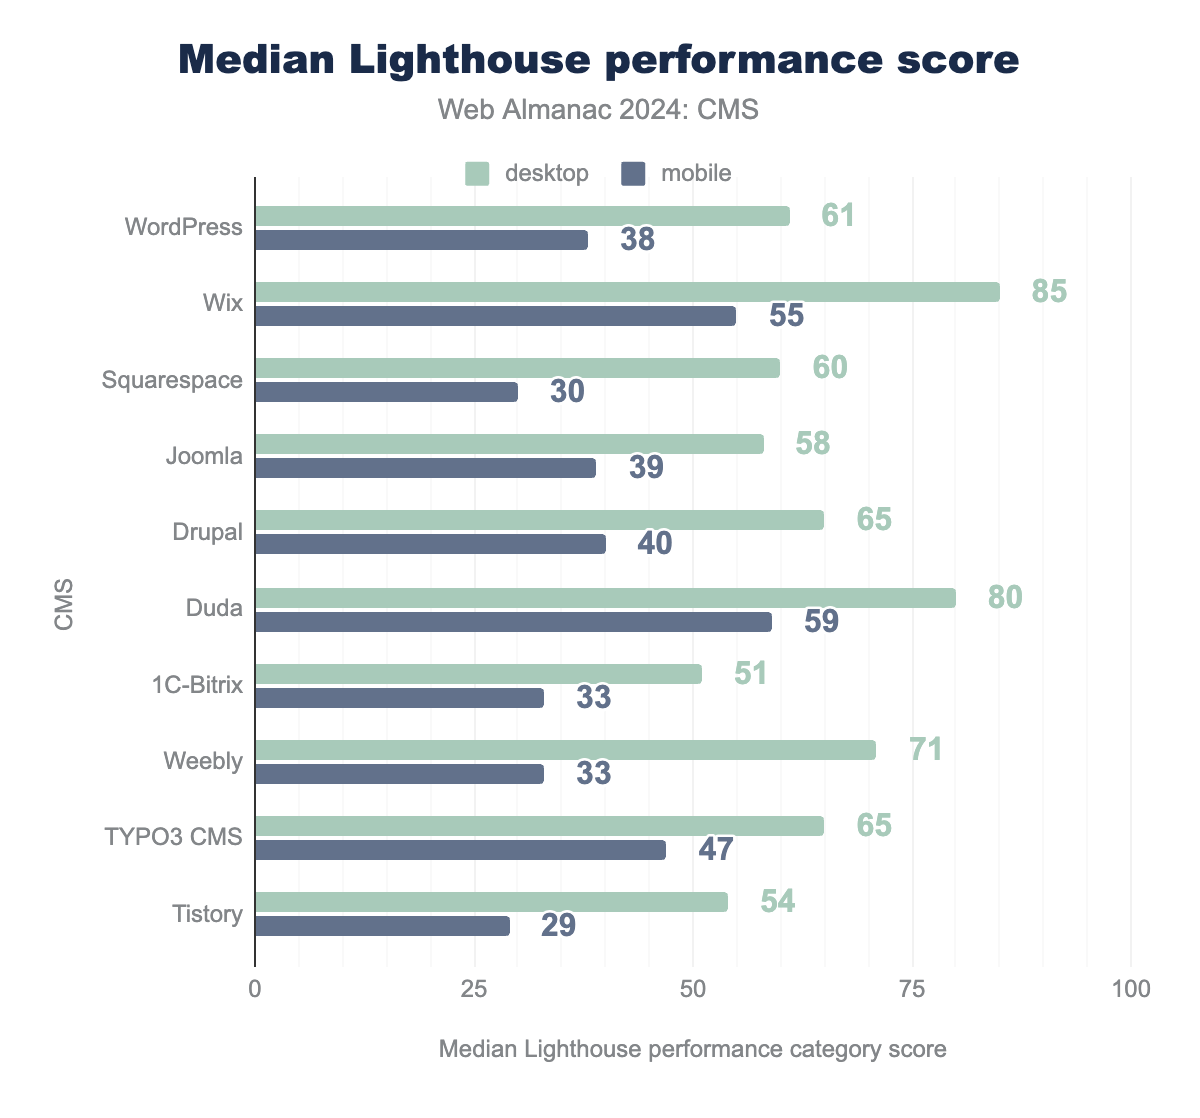
Compared to the 2022 results, where the median performance scores for most mobile platforms ranged from about 19 to 35, we observe impressive improvements for both mobile and desktop websites in 2024.
Wix and Duda stand out as clear leaders with median desktop performance scores of 85 and 80, respectively, and Duda achieving higher scores on mobile. Next come Weebly, Drupal, TYPO3 CMS, WordPress, and Squarespace, representing median performance scores marked with the orange “Needs Improvement” status, according to the Lighthouse color-coding scheme.
The overall positive trend is due to native and technological improvements in browsers and CMSs, which indicates an overall recognition of the importance of high-quality web performance.
The major increase shown by proprietary platforms such as Wix and Duda is partly connected to how the CMSs operate—meaning they benefit from a streamlined, centralized development that allows greater speed for innovation in the performance field.
As we’ve concluded in previous years, the lower mobile scores are an opportunity for smarter solutions, and optimizations focused on low-end devices with unstable network connections similar to those Lighthouse attempts to emulate. Moreover, it’s inherent for mobile devices to fall behind their desktop counterparts, given the faster CPUs and networks available. Nonetheless, the 2024 results are encouraging, and we’ll continue to track how CMS platforms fare regarding Lighthouse performance metrics.
Year-over-year performance trends
The YoY performance data from 2023 to 2024 reveals an encouraging trend of incremental improvements among top CMS platforms. Duda and Wix continue to lead in mobile performance, with Duda improving from a median Lighthouse score of 56 to 59 and Wix rising from 50 to 55. WordPress also shows improvement, increasing from 33 to 38, alongside Joomla and Drupal, which moved from 35 to 39 and 36 to 40, respectively. These results reflect a broader industry focus on optimizing mobile performance, although some platforms, such as Squarespace and Weebly, showed only minor gains. These varied improvements highlight the ongoing challenges and priorities across CMS platforms as they work toward enhanced user experiences on mobile devices.
SEO score
Search Engine Optimization (or SEO) is the practice of improving the quality and quantity of visitors to a website or a web page from a website to make it more easily found in search engines. This topic is covered in our SEO chapter, but it also relates to CMSs.
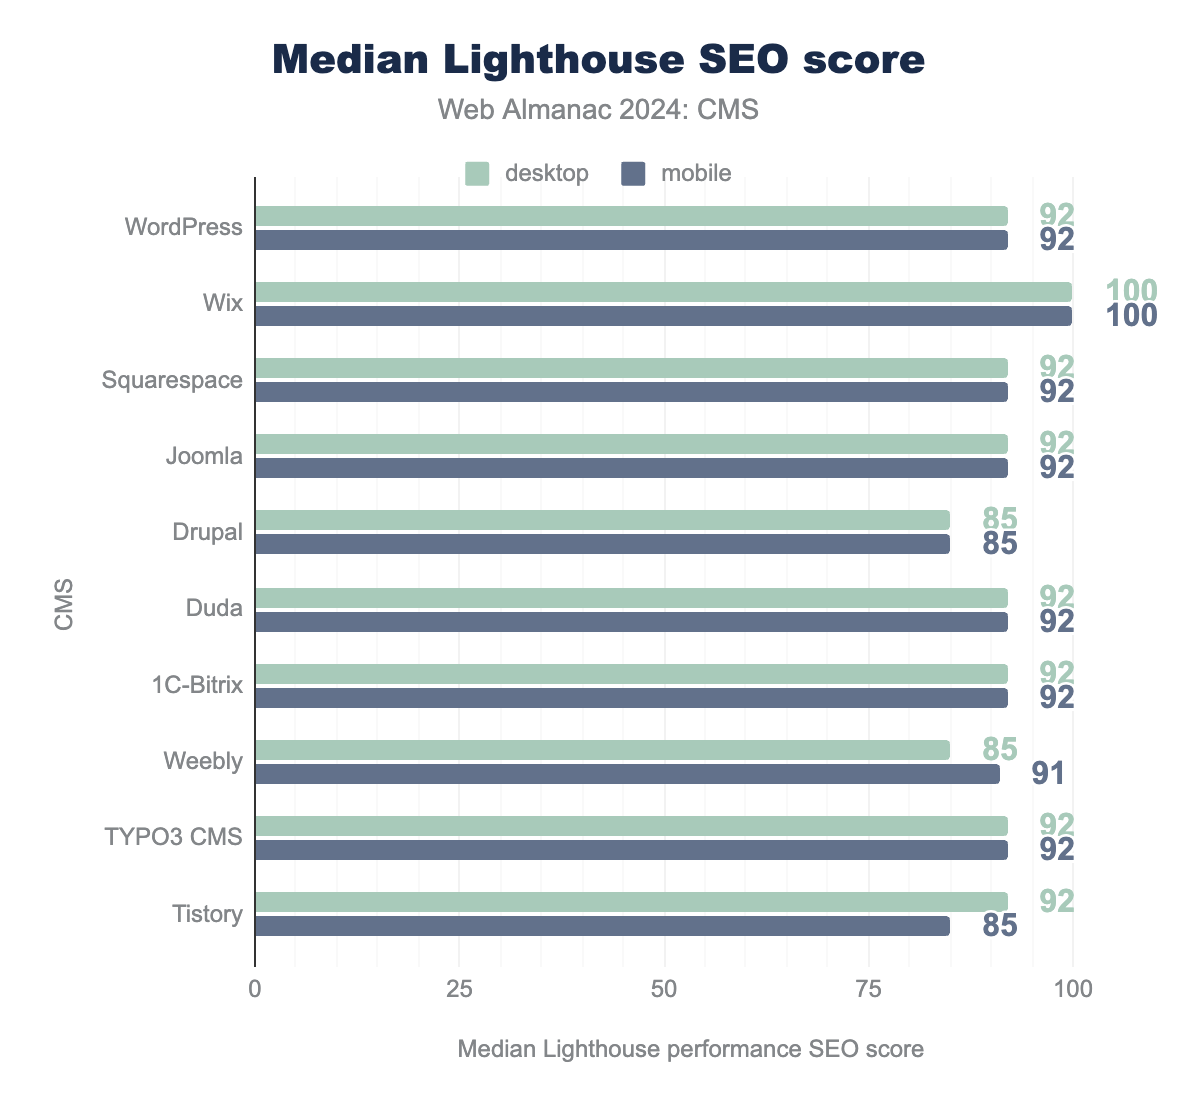
A CMS and content on it is generally set up to serve as much information to search engine crawlers as possible to make it as easy as possible for them to index site content appropriately in search engine results. Compared to a custom-built website, one might expect a CMS to provide good SEO capabilities, and the Lighthouse scores in this category remain appropriately high.
The median SEO scores in the top 10 platforms range from 85-100, an impressive increase from 82-92 in 2022. Given the high median performance scores, it is no surprise Wix takes the lead in SEO as well, scoring a perfect 100 for both mobile and desktop. With median scores as high as 92 for mobile and desktop, the runner-ups provide users with robust SEO best practices.
Year-over-year SEO trends
The year-over-year comparison from 2023 to 2024 reveals consistently high SEO scores across the top CMS platforms, with most maintaining or slightly improving their median scores. This stability at the high end suggests that CMS platforms are prioritizing SEO best practices, ensuring that users have solid foundations for search engine visibility.
Accessibility score
An accessible website is a site designed and developed so that people with disabilities can use them. Web accessibility also benefits people without disabilities, such as those on slow internet connections. Read more in our Accessibility chapter.
Lighthouse provides a set of accessibility audits and returns a weighted average of all of them. See scoring details for a full list of how each audit is weighted.
Each accessibility audit is either a pass or a fail, but unlike other Lighthouse audits, a page doesn’t get points for partially passing an accessibility audit. For example, if some elements have screen reader-friendly names but others don’t, that page gets a zero for the screen reader-friendly names audit.
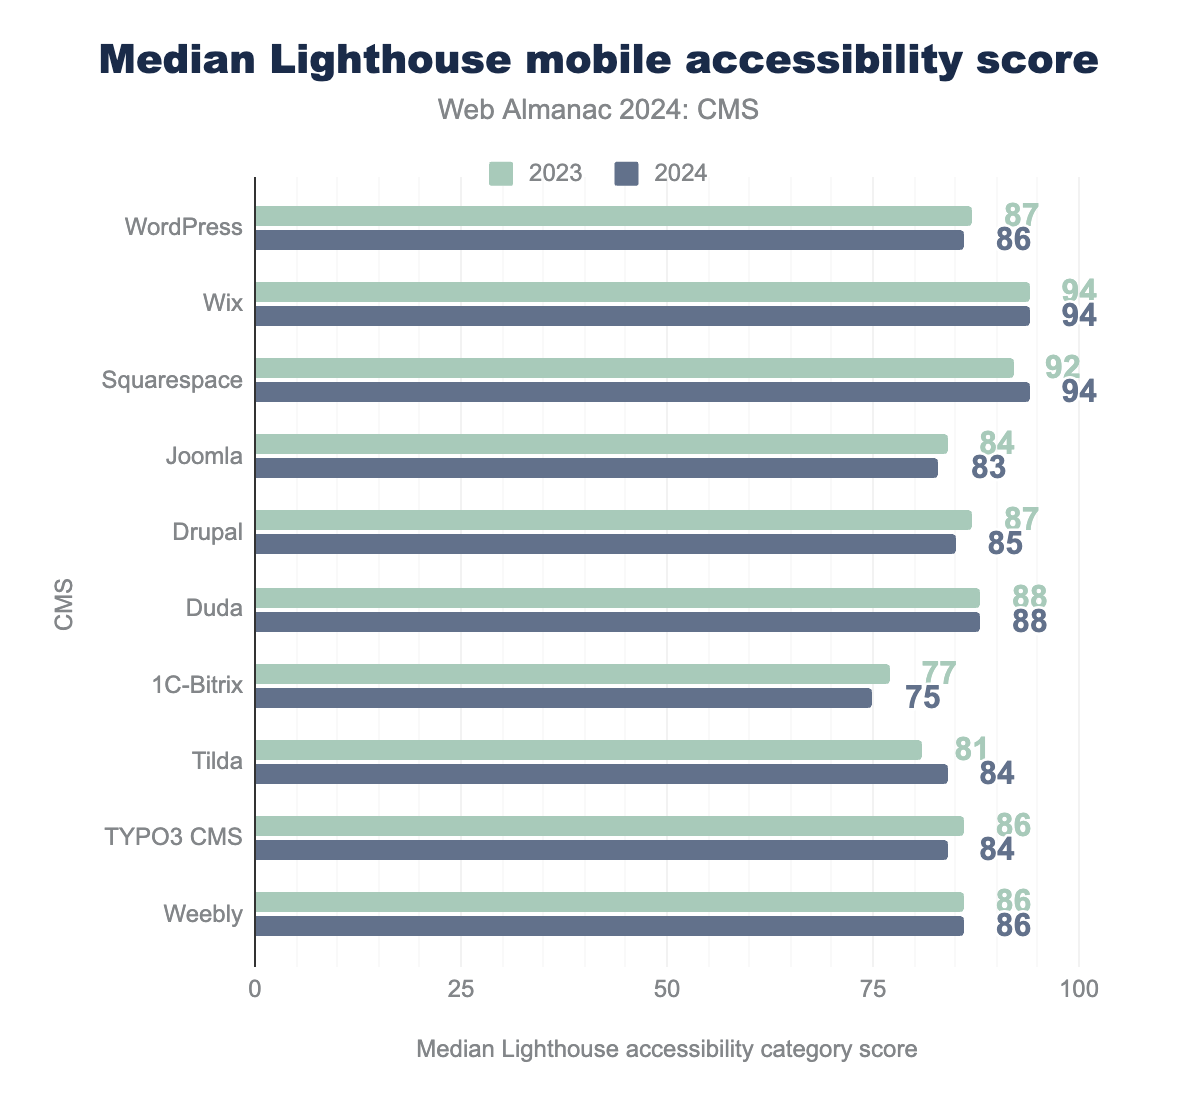
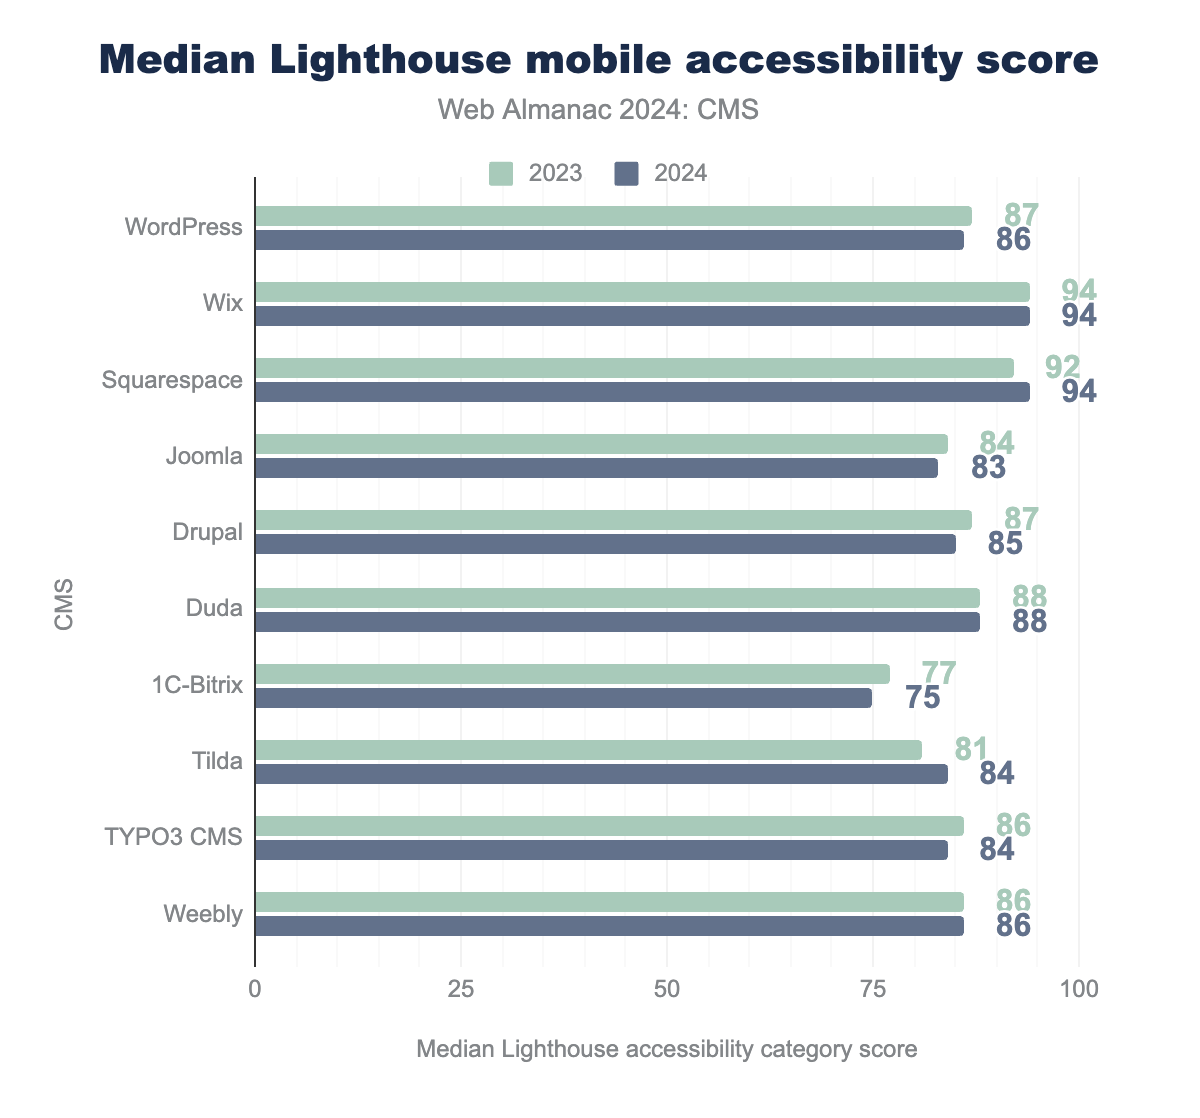
In 2024, the median Lighthouse accessibility score for the top 10 CMSs ranges between 74 and 95, a slight improvement from 77 to 91 in 2022. Squarespace has lost the top space by a fraction to Wix, which hits the 94 and 95 marks for mobile and desktop, respectively. 1C-Bitrix had the lowest accessibility scores in 2024 and shows a slight decrease of 2 points for both desktop and mobile, perhaps reflecting that the same sites are delivered to both desktop and mobile devices.
Year-over-year accessibility trends
The 2023 to 2024 comparison reveals largely stable accessibility scores across top CMS platforms, with most showing minimal changes. Wix shares the lead with Squarespace, holding steady with a high score of 94 for both years. Squarespace improved from 92 in 2023 to match Wix’s 94 in 2024. Notably, WordPress, Joomla, Drupal, and TYPO3 all saw minor declines. These scores suggest a steady emphasis on accessibility across the proprietary CMSs, with the open source CMSs demonstrating room for improvement.
Best practices
Lighthouse’s best practices audit evaluates whether web pages adhere to widely accepted web standards across various metrics. These include critical factors such as:
- HTTPS support,
- console error elimination,
- deprecated APIs avoidance,
- browser compatibility optimization,
- security protocols,
- and more.
By following these best practices, developers can enhance both the functionality and user experience of their websites, ensuring a more secure, stable, and reliable performance across different browsers and devices.
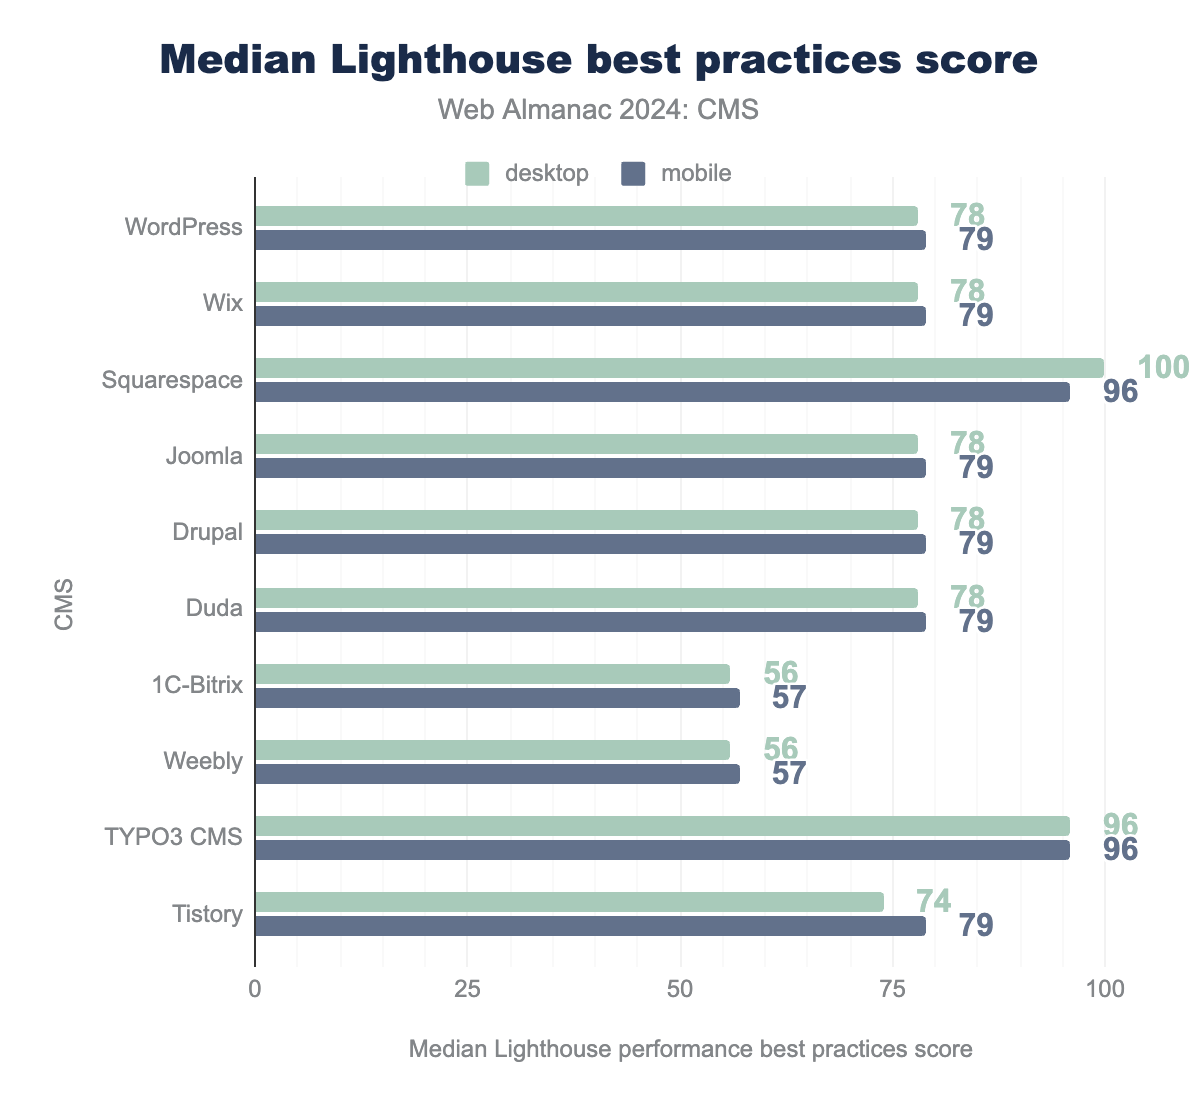
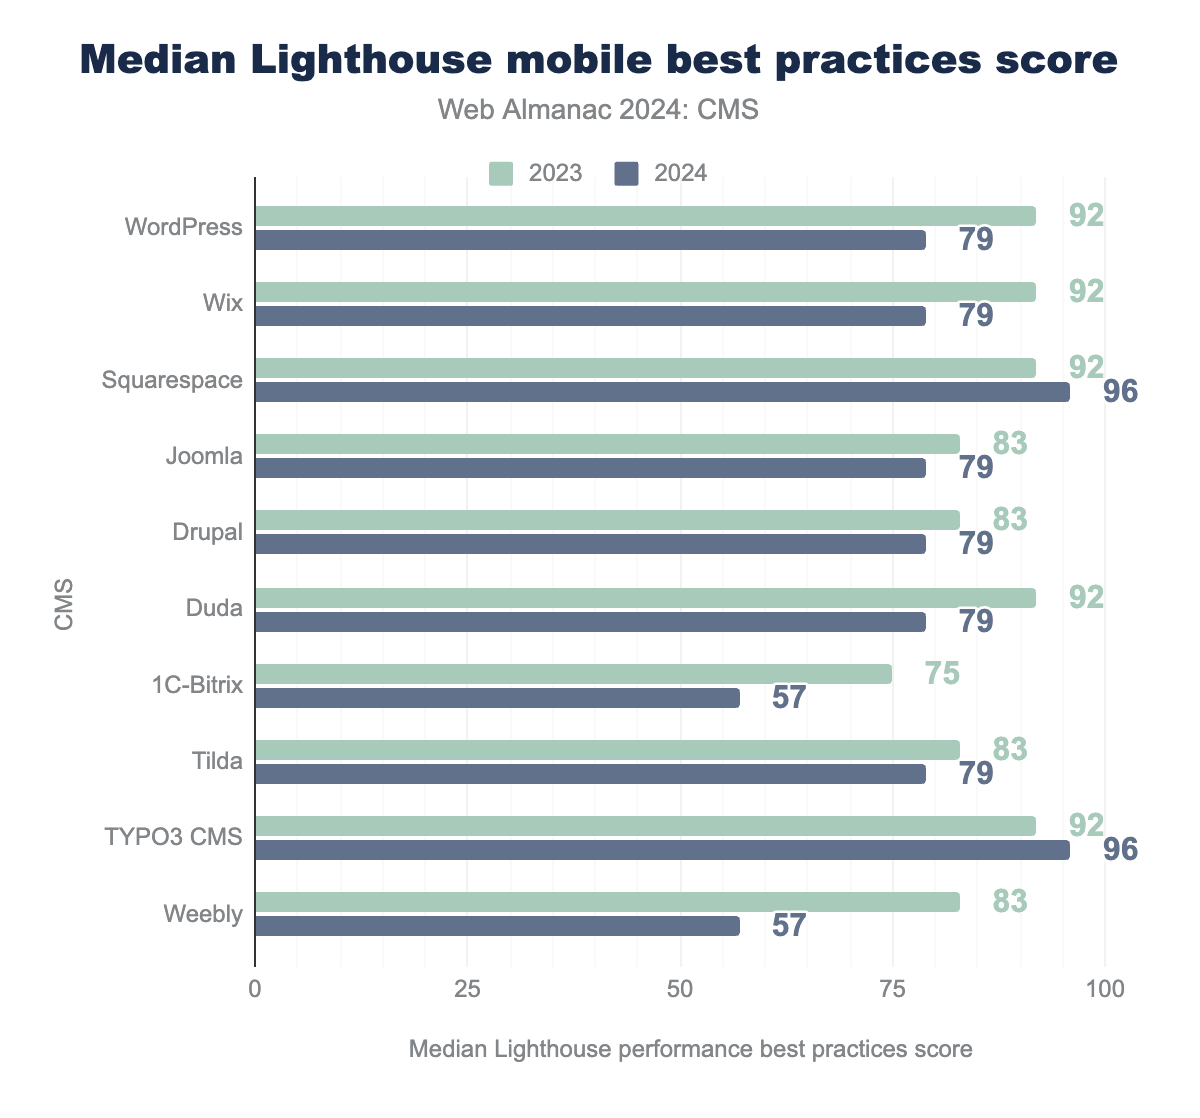
Our 2024 analysis shows significant changes across the board compared to the results in 2022. Squarespace takes the lead from Wix, with the highest median best practices score of 100, while many of the other top 10 platforms share a score of 78 (a slight improvement since 2022).
While most other CMSs show worse numbers in the best practices audits, TYPO3 CMS claims the second place with a 96-median score for both mobile and desktop, compared to 83 and 92 (mobile and desktop, respectively) in 2022.
Year-over-year Best Practices Trends
The YoY comparison from 2023 to 2024 shows stable best practices scores across most CMS platforms. Squarespace and TYPO3 CMS share the top position in 2024, each with a best practices score of 96. Most other platforms, including WordPress, Wix, Joomla, Drupal, Duda, and Tilda, maintained steady scores of 79, reflecting consistent adherence to web standards. In contrast, 1C-Bitrix and Weebly scored lower at 57, highlighting areas where these platforms could improve in best practices compliance.
Resource weights
We leveraged HTTP Archive data to analyze the resource weight across various CMS platforms, aiming to uncover opportunities for performance optimization. While page loading speed isn’t solely determined by the number of downloaded bytes, reducing the amount of data required to load a page offers several advantages.
Fewer bytes mean lower bandwidth costs, reduced carbon emissions, and faster performance—particularly for users on slower connections. This analysis sheds light on areas where resource optimization can have a meaningful impact on both user experience and sustainability. Read the Page Weight chpater for a more detailed analysis.
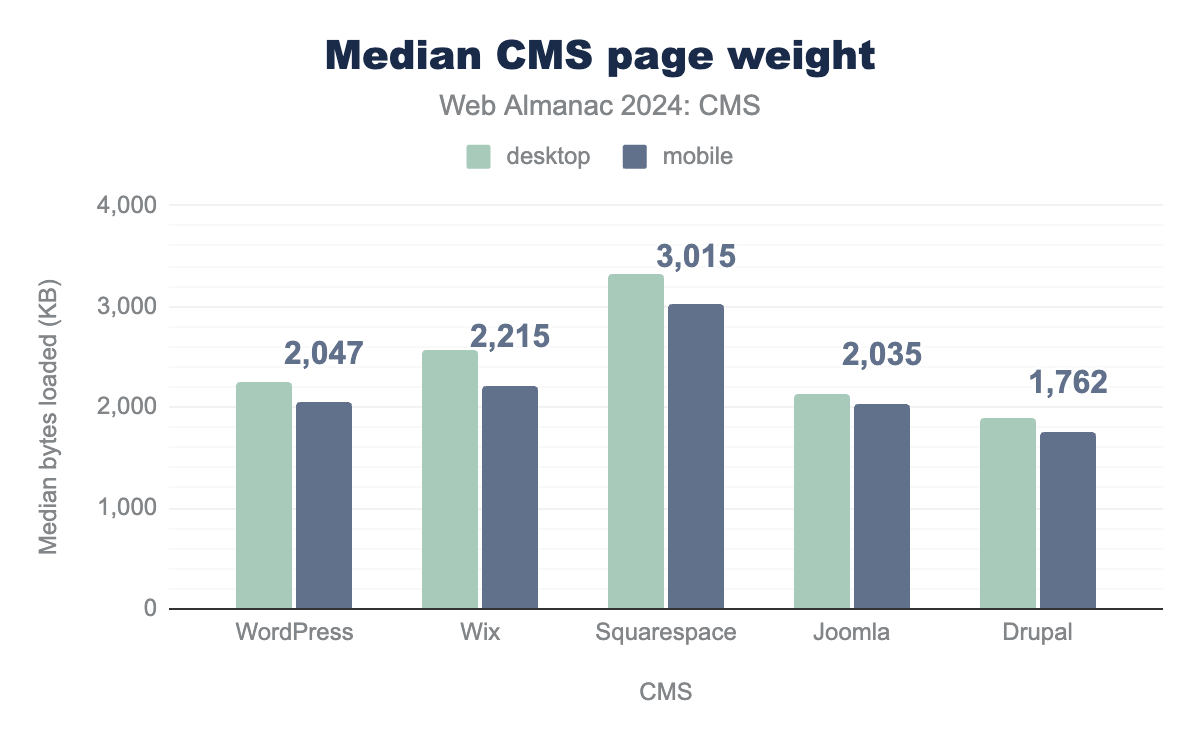
Although we observed a steady trend in increasing page weight over the past several years, in 2024, almost all top five CMSs show notable improvements. Drupal’s median page weight has dropped to ~1.7 MB compared to ~2.1 MB in 2022. WordPress and Joomla now hover closely to ~2 MB compared to ~2.3 MB in 2022. Wix is the only CMS on the board that shows a slight increase in median page weight—2.2 MB compared to 2.1MB in 2022. Squarespace continues to deliver the heaviest median page weight of ~3 MB compared to ~3.5MB in 2022.
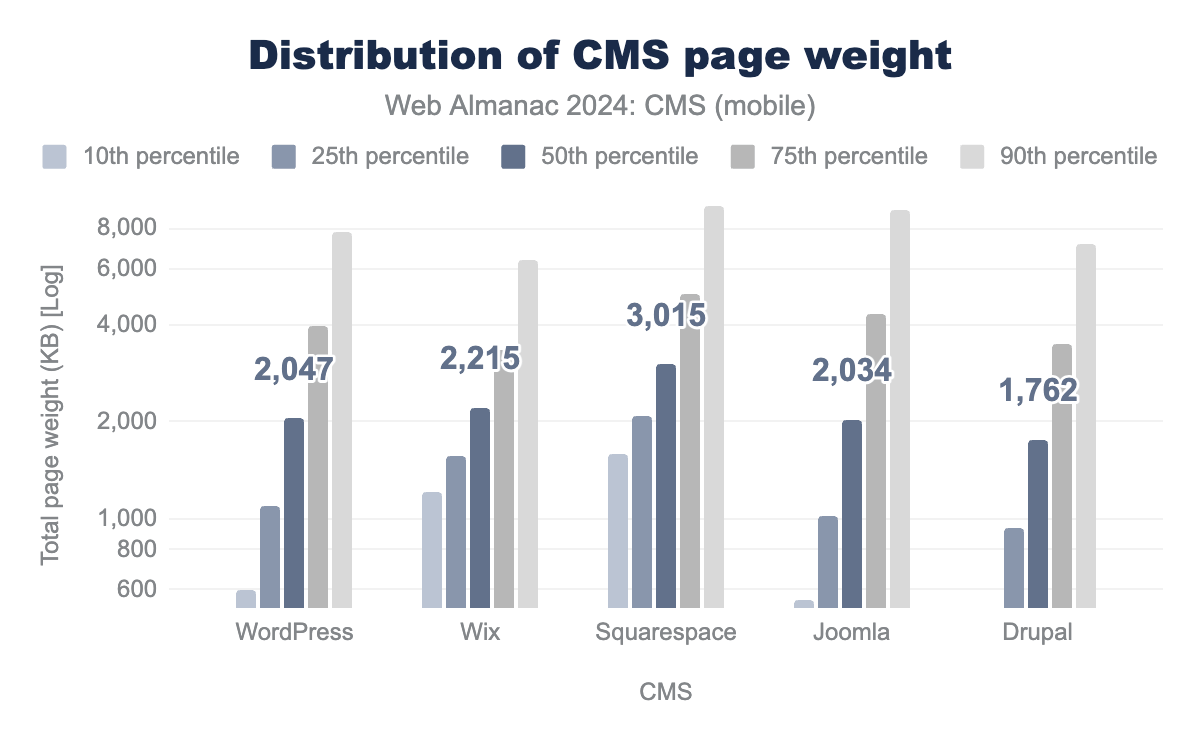
The distribution of page weight in each platform’s percentiles is substantial. Page weight is probably related to the differences in user content across web pages, the number of images used, plugins installed, etc. The smallest pages delivered per platform come from Drupal, followed closely by WordPress—both improving on their results from 2022 (2.1 MB and 2.3 MB, respectively).
This year, Drupal only sends 524 KB for their 10th percentile of visits, while Joomla and WordPress are not falling far behind—561 KB and 598 KB, respectively. With a notable decrease, but still serving the largest pages here, is Squarespace, with ~9.4 MB delivered for their 90th percentile of visits, a ~2 MB decrease compared to 2022 data.
Page weight breakdown
Page weight refers to the total size, measured in kilobytes, of all the resources loaded on a web page. These resources—such as images, JavaScript, CSS, HTML, and fonts—collectively influence the page’s performance.
Below, we analyze and compare the resource weight across different CMS platforms, providing insights into how each CMS contributes to the overall page weight.
Images
Images are a significant resource on most websites, often accounting for the largest portion of page weight. In CMS platforms, where visuals are heavily relied upon for design and engagement, image optimization is essential. High-resolution images can slow down page load times if not properly compressed or served in modern formats like WebP. Read more in our Media chapter.
In 2024, Wix continues to deliver substantially fewer image bytes, with only 152 KB delivered for the median of mobile views (138 KB less than in 2022). This suggests good use of image compression and lazy image loading. All the other top four platforms deliver below 1 MB of images—a significant improvement compared to 2022 data (WordPress 1,1 MB; Squarespace ~1,7 MB, Joomla ~1,5 MB, and Drupal ~1,1 MB).
Advanced image formats greatly improve compression, enabling resource savings and faster site loading. WebP is commonly supported in all major browsers today, with over 95% support. In addition, newer image formats continue to gain popularity and adoption, namely AVIF.
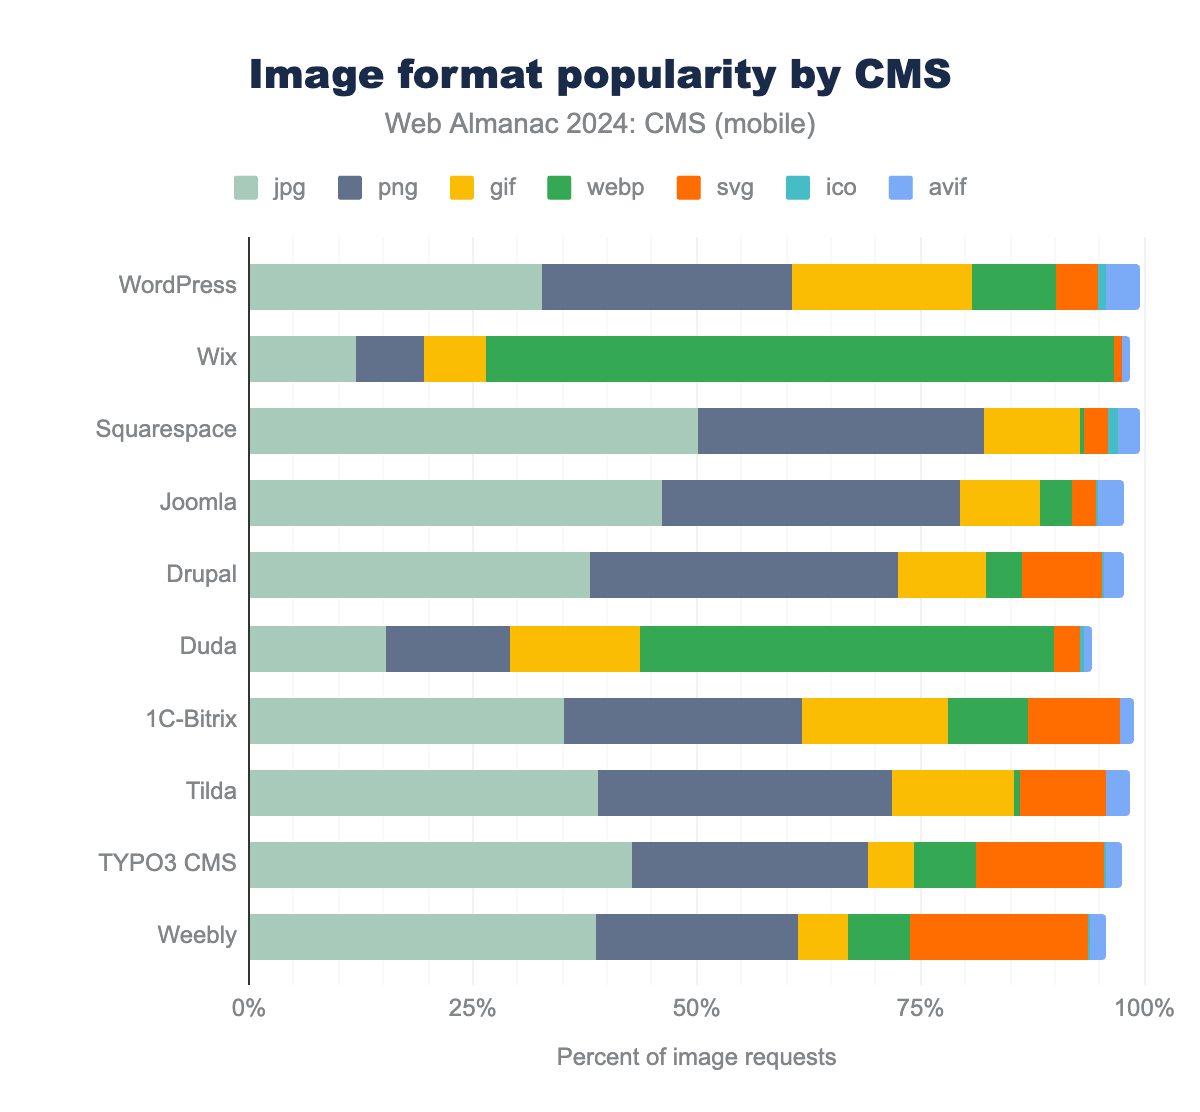
We can examine the usage of the different image formats across the top CMSs:
In 2024, Wix and Duda continue to make the most use of WebP, at ~75% and ~60% adoption, respectively, while the rest show minor increases.
Although WebP is now widely supported, we still observe that platforms are underutilizing the format. With the growing support of WebP, it seems all platforms have work to do to reduce the usage of the older JPEG and PNG formats without compromising on image quality.
As of WordPress 5.8, WordPress supports the WebP format and can be set to automatically convert uploaded images to WebP. However, the popularity of the format seems to have plateaued compared to the 2022 data. This can be explained by the more holistic approach the core Performance team at WordPress has chosen toward general performance improvements on the platform. Read more in the section WordPress in 2024.
JavaScript
JavaScript powers much of the interactive functionality on modern websites. CMS platforms frequently use various JS libraries and frameworks to enable features like dynamic content loading, form validation, and user engagement tools. However, excessive or poorly optimized JavaScript can negatively impact performance. Find more detailed information in our JavaScript chapter.
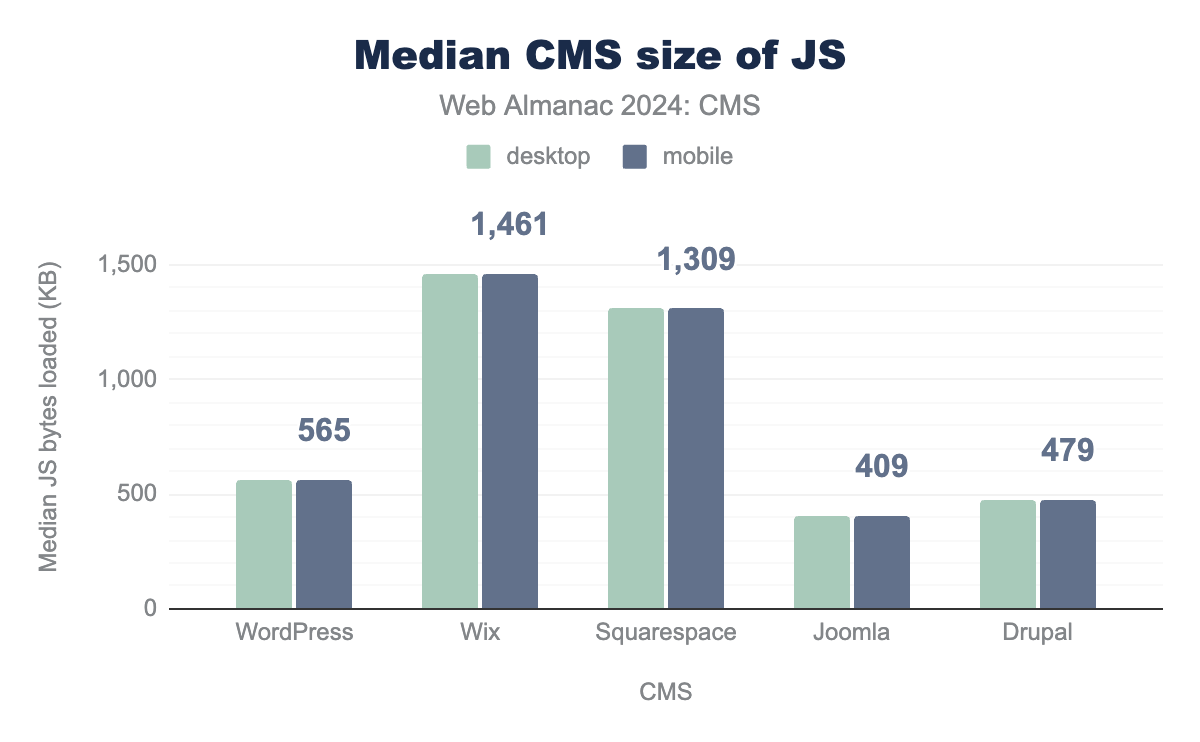
In 2024, we observe rising JavaScript usage across the board. Almost all top five CMSs deliver more JavaScript compared to 2022 data, with Squarespace seeing a major increase, from 997 KB to ~1,3 MB. Wix still delivers the most JavaScript with a slight increase, from ~1,3 MB to ~1,4 MB. Drupal and WordPress show minor JavaScript growth, with Joomla delivering the least JS at 409 KB (an improvement from 2022’s 452KB).
HTML
HTML forms the structural backbone of any web page, defining the layout and content. CMS platforms automatically generate much of the HTML code, sometimes leading to bloated and inefficient markup. While HTML is typically lightweight compared to other resources, unoptimized or overly complex HTML structures can still affect render time and user experience. Find more detailed information in the Markup chapter.
Examining the HTML document sizes, we can see that most of the top CMSs deliver a median HTML size of ~22 KB–38 KB. The only exception is Wix, which delivers ~142 KB, a notable increase over 2022’s results. This may suggest extensive use of inlined resources and shows an area that can be further improved.
CSS
CSS controls the visual styling of a website, dictating elements like layout, colors, and fonts. On CMS platforms, themes and templates often come with extensive CSS files that may include unused or redundant styles. Large CSS files can increase page weight and slow down rendering times.
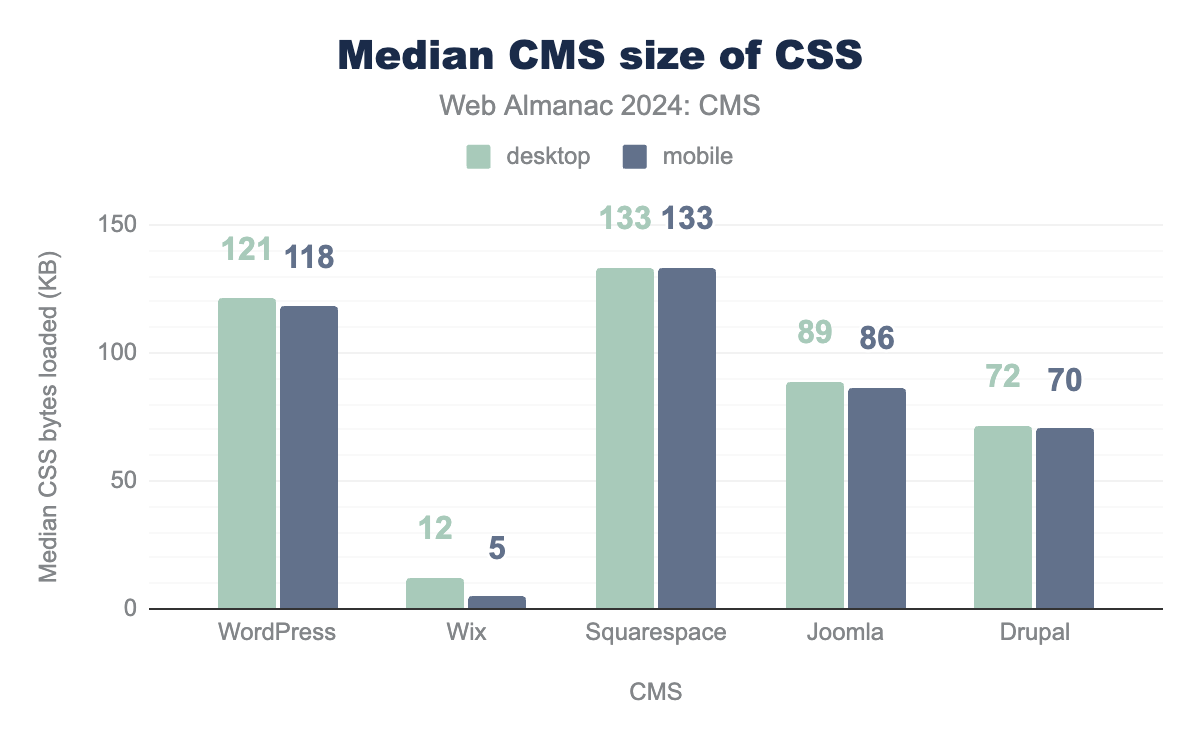
In 2024, we see a different distribution between platforms that strengthens the case for inlining CSS. Wix delivers the fewest CSS resources, dropping from 9 KB to 5 KB on mobile views in 2022. Squarespace delivers significantly more CSS this year—133 KB from 89 KB in 2022. WordPress comes second in CSS delivery with a slight increase from 2022 numbers. Drupal also shows a minor increase, while Joomla is the only CMS platform that delivers less CSS in 2024.
Fonts
CMS-based websites frequently offer a variety of fonts to enhance branding and visual appeal. However, fonts can introduce additional weight to a page, especially when multiple font families or variations are loaded. Unoptimized font loading can delay text rendering and impact the user experience. Explore the Fonts chapter for a detailed breakdown.
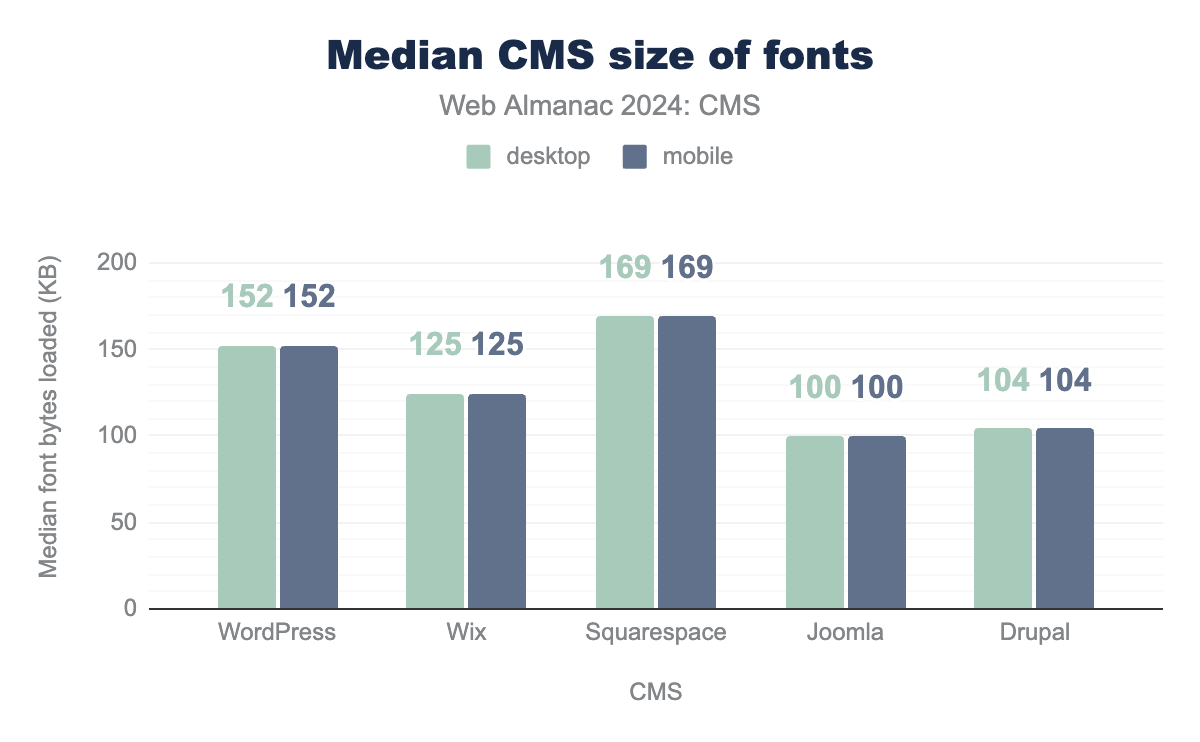
This year, all top five CMSs show changes in the amount of font bytes delivered. Squarespace continues to deliver the highest amount at 169 KB (a significant decrease from 202 KB in 2022). Wix also shows a slight decrease in font file delivery, while WordPress, Joomla, and Drupal all have increased the amount of font bytes served. It would be interesting to see if the growing integration of Google-hosted fonts will impact next year’s results.
WordPress in 2024
Of the over 16 million mobile sites in this year’s crawl, WordPress is used by 5.7 millions sites for a total of 36% of sites. By comparison, the next closest CMS is Wix, with 456,253 sites or 3% of sites.
WordPress’s global dominance stems from two main factors—a community that maintains and improves the functionality of the open-source project, and the CMS’s flexibility in serving a wide range of websites and users.
Furthermore, the availability of tens of thousands of plugins, themes, and page builders allows users from all kinds of technical backgrounds to choose WordPress as their go-to CMS option. However, these easy ways to expand functionality can be a double-edged sword, especially with regards to performance.
In the following section, we review page builder adoption,along with improvements introduced by the Core Performance Team.
Page builders
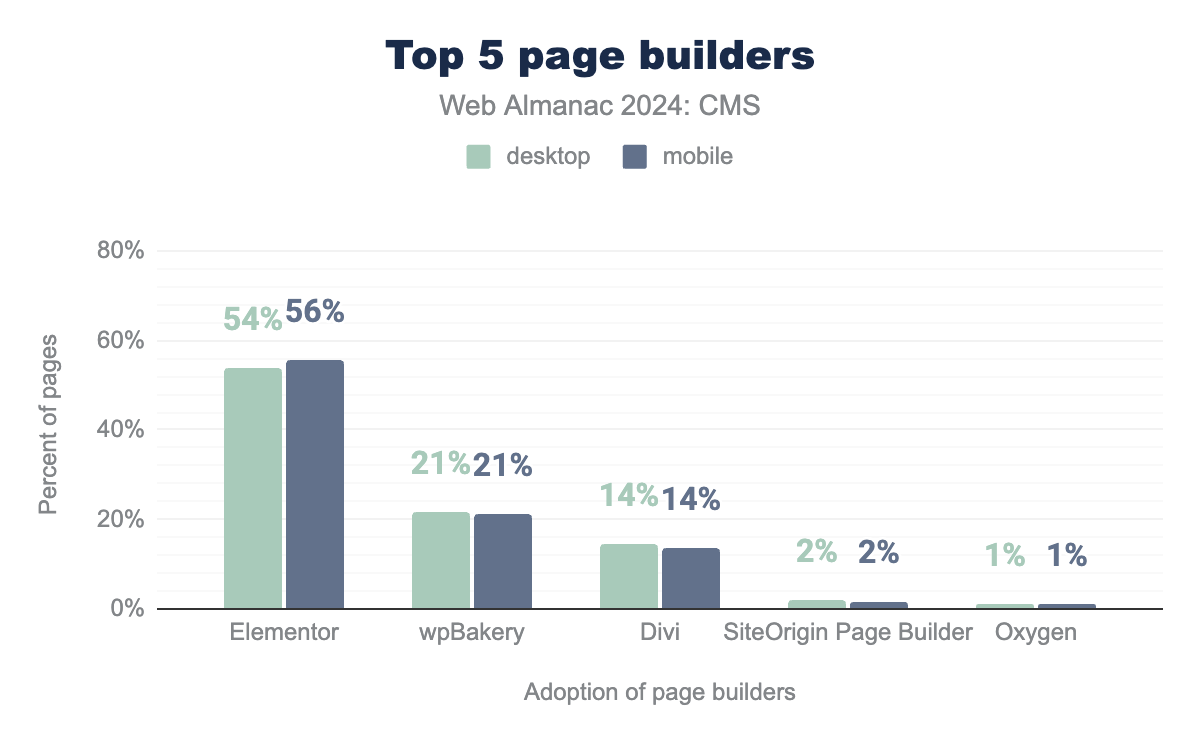
WordPress users often leverage a “page builder” that provides an interface within the CMS for content management. Thanks to the improvement of Wappalyzer’s detection methods, we can follow page builder adoption trends compared to our 2022 results.
We discovered that of the WordPress sites attributed to a page builder, Elementor and WPBakery remain the clear winners (13% and 12% increase for mobile, respectively), with Divi, SiteOrigin, and Oxygen trailing behind.
As we see it today, page builders can significantly influence a site’s performance. Historically, page builders have been anecdotal indicators of poor performance. As one example, our dataset indicates that it’s not uncommon for websites to have multiple page builders installed, significantly increasing the resources loaded by a site.
Thanks to native performance improvements and advancements, however, page builders tend to offer leaner alternatives, which are becoming increasingly popular among site owners. Paired with best practices when developing a website, they can now achieve better overall performance in WordPress, more of which we cover in the next section.
Latest performance improvements in WordPress
The WordPress Core Performance Team monitors, enhances, and promotes performance in WordPress core and its surrounding ecosystem. The group was established in 2021 to increase the performance of WordPress Core, which in turn improved the performance of the average WordPress site.
Fast forward to 2024, and it’s safe to say the team has exceeded expectations, merging in a significant number of performance updates across each major release of WordPress.
Furthermore, since they first kicked off the project in November 2021, WordPress’s overall Core Web Vitals pass rate has surged by 12%.
These are some of the enhancements that led to these results:
- WordPress 6.0: Improvements to the WordPress Caching API, taxonomy term queries, and performance increase for sites with large user counts
- WordPress 6.3: More than 170 performance updates merged into the core, improvements in LCP and TTFB for block and classic themes, added support for the fetchpriority=”high” attribute on images, introduced script loading strategies, which adds support for loading scripts with defer or async.
- WordPress 6.4: Merged over 100 performance updates and implemented script loading strategies for frontend scripts in core and bundled themes.
- WordPress 6.5: Introduced multiple performance improvements, including support for the AVIF image format and a faster localization system.
The team also released the Performance Lab plugin, which is a collection of performance-related “feature projects” that may eventually be merged into the WordPress core software:
- Image Placeholders
- Modern Image Formats
- Performant Translations
- Embed Optimizer (experimental)
- Enhanced Responsive Images (experimental)
- Image Prioritizer (experimental)
Speculative Loading is another plugin that is part of the Performance Lab and has been recently made available. This plugin enables support for the Speculation Rules API, allowing the definition of rules to dynamically prefetch or prerender specific URLs based on user interactions. We discuss this API more in the next section. By default, it is set to prerender WordPress frontend URLs when a user hovers over a relevant link, allowing users to experience instant page load times.
Since its release, the plugin’s adoption has steadily grown, reaching over 30,000 active installations as of this chapter’s writing.
Emerging trends and technologies
Although we didn’t have enough data regarding adoption and real-world impact to add to this year’s edition, some emerging technologies promise to boost the overall performance of all CMS platforms and the web as a whole.
That’s why we decided to include them still, keep an eye on them, and revisit their impact in 2025.
Speculation Rules API
The Speculation Rules API is a JSON-defined API developed by Google to enhance the performance of subsequent page navigation, leading to faster rendering times and improved user experiences. We already saw how the Speculative Loading WordPress plugin made use of this in the previous section.
This API enables developers to specify which URLs should be dynamically prefetched or prerendered:
- Prefetching: Fetches resources (like pages or assets) in the background before they are requested by the user, reducing load time when the user eventually navigates to the prefetched content.
- Prerendering: Fully renders a page in the background, so it is immediately available with no load time when the user navigates to it.
Furthermore, the API improves performance based on user behaviors, such as hovering over links or predicted navigation patterns, allowing content to load more quickly when needed.
To fine-tune when speculations should fire, developers can adjust the “eagerness” setting:
- Eager: Speculation rules are triggered immediately when conditions are met.
- Moderate: Speculation occurs after a short delay, such as when a user hovers over a link for at least 200 milliseconds, indicating some level of intent.
- Conservative: Speculation is triggered only with more definitive user actions, such as tapping or clicking on a link, signaling a higher likelihood of navigation.
These eagerness levels allow developers to balance performance optimization with resource management, ensuring that the browser preloads or prerenders content at appropriate times.
Long Animation Frames API (LoAF)
The Long Animation Frames API (LoAF) is designed to improve upon the Long Tasks API. It was shipped with Chrome 123 and provides developers with more actionable insights to address responsiveness issues and improve Interaction to Next Paint (INP).
Responsiveness refers to how quickly a page reacts to user interactions, ensuring updates are painted without delay. For INP, a response time under 200 milliseconds is ideal, though even shorter times may be necessary for animations.
Instead of measuring individual tasks, LoAF focuses on long animation frames, defined as frames that take longer than 50 milliseconds to render, helping identify blocking work more effectively.
Artificial Intelligence (AI)
Artificial Intelligence (AI) is reshaping how users build, manage, and optimize websites. AI-driven tools and plugins are becoming more prevalent, enabling automation, personalization, and enhanced user experiences.
Regarding the WordPress ecosystem, it seems like the community has yet to fully embrace the AI trend. In a thread from May 2023, the core WordPress team and contributors exchanged opinions about the role of AI in the CMS.
Following the discussion, several highlights stand out:
- AI should remain in the plugin space: Since AI integrations currently rely on third-party systems and pricing, it’s more likely to be adopted through plugins rather than Core—at least until AI models are fast enough to run directly on servers.
- Developer Experience (DX) as a focus for innovation: Some suggest that addressing current DX limitations, especially in the block editor, should be a priority. Enhancing extensibility could allow plugins more freedom to experiment with AI integrations.
- AI for collaboration: Others propose using AI to enhance collaboration and workflows, such as adding AI chatbots as a new user type as part of Phase 3 of the Gutenberg roadmap. A bolder idea is integrating a personal AI assistant into the admin panel for business support.
WordPress core aside, AI has been adopted by numerous plugins that offer content generation, personalization, chatbots, and more. So, it’s safe to say that AI has already started changing the WordPress ecosystem.
Conclusion
CMS platforms have continued their upward trajectory in 2024, becoming increasingly integral to the fabric of the internet as they support a diverse range of content creators, businesses, and users worldwide. With adoption rates steadily rising, CMSs are not only shaping how people create and manage content but also enhancing how users experience and engage with the web.
This year, the industry-wide focus on performance and user experience has deepened, with CMS platforms showing steady improvements across Core Web Vitals and Lighthouse scores. Many CMSs have embraced optimization strategies that enhance loading speed, interactivity, and accessibility, reflecting a shared commitment to a user-first web. The adoption of Interaction to Next Paint (INP) as a Core Web Vital has given us a more comprehensive measure of responsiveness, a new standard for page load times, and higher expectations for browsing experiences across devices and network conditions.
Challenges persist, however. As CMSs expand their capabilities and adopt new technologies, balancing added functionality with performance remains crucial. Issues such as page weight and JavaScript load continue to impact some platforms, especially on mobile, underscoring the importance of ongoing optimization and adherence to best practices.
Looking ahead, we’re excited to see how CMSs will continue to evolve, with emerging technologies like AI transforming content creation and speculative loading improving performance. Although they’re still in their early stages of development, these new technologies have the potential to redefine web performance and engagement. As we expand our datasets and refine our methodologies, we’ll aim to provide an even clearer picture of the state of the web — and the CMS. Here’s to a faster, more accessible, and user-friendly web—let’s keep making it better together.
