Markup

Introduction
The web is built on HTML. Without HTML there are no web pages, no web sites, no web apps. Nothing. There may be plain-text documents, perhaps, or XML trees, in some parallel universe that enjoyed that particular kind of challenge. In this universe, HTML is the foundation of the user-facing web. There are many standards that the web is resting on, but HTML is certainly one of the most important ones.
How do we use HTML, then, how great of a foundation do we have? In the introductory section of the 2019 Markup chapter, author Brian Kardell suggested that for a long time, we haven’t really known. There were some smaller samples. For example, there was Ian Hickson’s research (one of modern HTML’s parents) among a few others, but until last year we lacked major insight into how we as developers, as authors, make use of HTML. In 2019 we had both Catalin Rosu’s work (one of this chapter’s co-authors) as well as the 2019 edition of the Web Almanac to give us a better view again of HTML in practice.
Last year’s analysis was based on 5.8 million pages, of which 4.4 million were tested on desktop and 5.3 million on mobile. This year we analyzed 7.5 million pages, of which 5.6 million were tested on desktop and 6.3 million on mobile, using the latest data on the websites users are visiting in 2020. We do make some comparisons to last year, but just as we’ve tried to analyze additional metrics for new insights, we’ve also tried to impart our own personalities and perspectives throughout the chapter.
General
In this section, we’re covering the higher-level aspects of HTML like document types, the size of documents, as well as the use of comments and scripts. “Living HTML” is very much alive!
Doctypes
96.82% of pages declare a doctype. HTML documents declaring a doctype is useful for historical reasons, “to avoid triggering quirks mode in browsers” as Ian Hickson explained in 2009. What are the most popular values?
| Doctype | Pages | Pages (%) |
|---|---|---|
| HTML (“HTML5”) | 5,441,815 | 85.73% |
| XHTML 1.0 Transitional | 382,322 | 6.02% |
| XHTML 1.0 Strict | 107,351 | 1.69% |
| HTML 4.01 Transitional | 54,379 | 0.86% |
| HTML 4.01 Transitional (quirky) | 38,504 | 0.61% |
You can already tell how the numbers decrease quite a bit after XHTML 1.0, before entering the long tail with a few standard, some esoteric, and also bogus doctypes.
Two things stand out from these results:
- Almost 10 years after the announcement of living HTML (aka “HTML5”), living HTML has clearly become the norm.
- The web before living HTML can still be seen in the next most popular doctypes, like XHTML 1.0. XHTML. Although their documents are likely delivered as HTML with a MIME type of
text/html, these older doctypes are not dead yet.
Document size
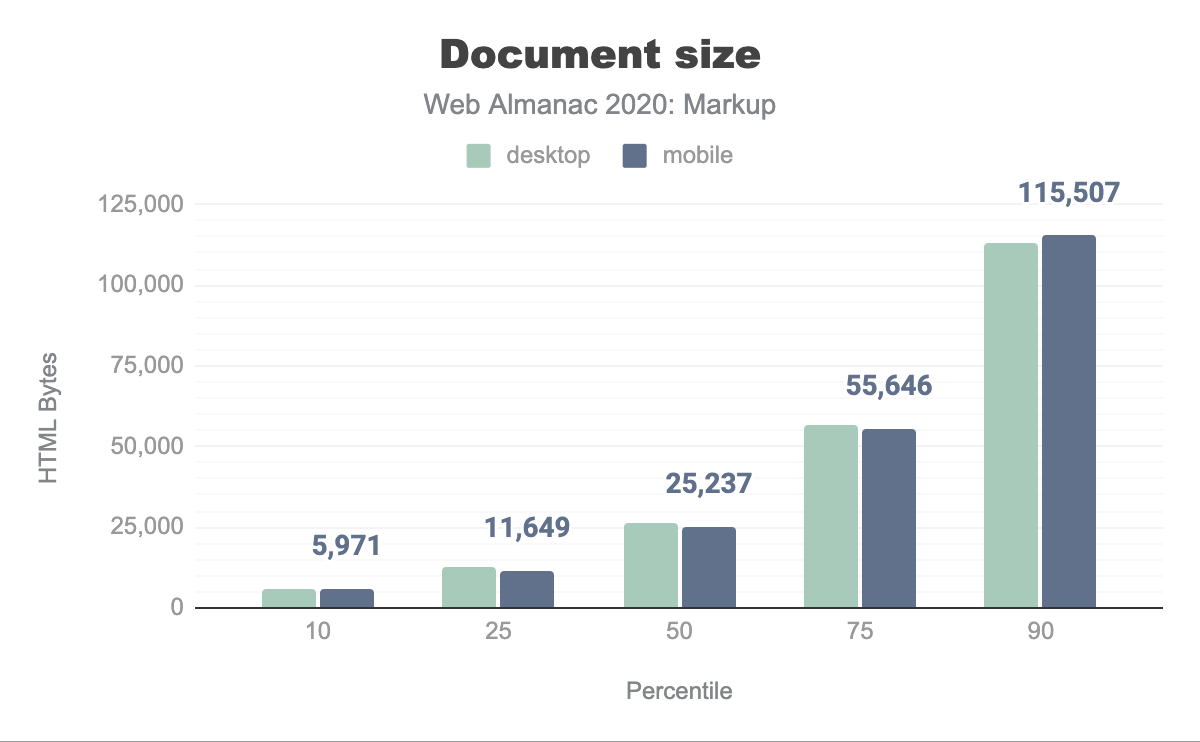
A page’s document size refers to the amount of HTML bytes transferred over the network, including compression if enabled. At the extremes of the set of 6.3 million documents:
- 1,110 documents are empty (0 bytes).
- The average document size is 49.17 KB (in most cases compressed).
- The largest document by far weighs 61.19 MB, almost deserving its own analysis and chapter in the Web Almanac.
How is this situation in general, then? The median document weighs 24.65 KB, which comes without surprises:
Document language
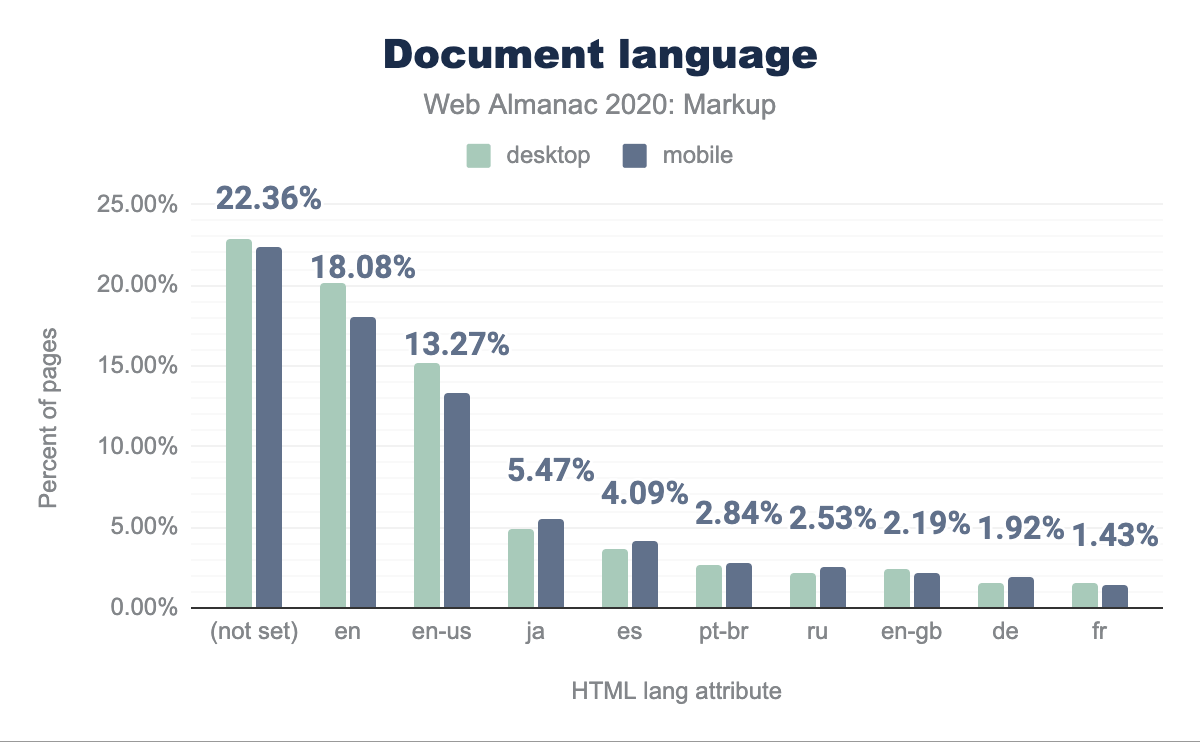
We identified 2,863 different values for the lang attribute on the html start tag (compare that to the 7,117 spoken languages as per Ethnologue). Almost all of them seem valid, according to the Accessibility chapter.
22.36% of all documents specify no lang attribute. The commonly accepted view is that they should, but ignoring the fact that software could eventually detect language automatically, document language can also be specified on the protocol level, which is something we didn’t check.
Here are the 10 most popular (normalized) languages in our sample. It’s important to note that the HTTP Archive crawls from US data centers with English language settings, so looking at the language pages are written in, will be skewed towards English. Nevertheless we present the lang attributes seen to give some context to the sites analyzed.
lang attributes used in our crawl with 22.82% of desktop and 22.36% of mobile pages not setting this, en being used on 20.09% and 18.08% respectively, ja on 15.17% and 13.27%, es on 4.86% and 4.09% , pt-br on 2.65% and 2.84%, ru on 2.21% 2.53%, en-gb on 2.35% and 2.19%, de on 1.50% and 1.92%, and finally fr being used on 1.55% and 1.43% respectively.lang attributes.
Comments
Adding comments to code is generally a good practice and HTML comments are there to add notes to HTML documents, without having them rendered by user agents.
<!-- This is a comment in HTML -->Although many pages will have been stripped of comments for production, we found that home pages in the 90th percentile are using about 73 comments on mobile, respectively 79 comments on desktop, while in the 10th percentile the number of the comments is about 2. The median page uses 16 (mobile) or 17 comments (desktop).
Around 89% of pages contain at least one HTML comment, while about 46% of them contain a conditional comment.
Conditional comments
<!--[if IE 8]>
  <p>This renders in Internet Explorer 8 only.</p>
<![endif]-->
The above is a non-standard HTML conditional comment. While those have proven to be helpful in the past in order to tackle browser differences, they have been consigned to history for some time as Microsoft dropped conditional comments) in Internet Explorer 10.
Still, on the above percentile extremes, we found that web pages are using about 6 conditional comments in the 90th percentile, and 1 conditional comment while in the 10th percentile. Most of the pages include them for helpers such as html5shiv, selectivizr, and respond.js. While being decentish and still active pages, our conclusion is that many of them were using obsolete CMS themes.
For production, HTML comments are usually stripped by build tools. Considering all the above counts and percentages, and referring to the use of comments in general, we suppose that lots of pages are served without involving an HTML minifier.
Script use
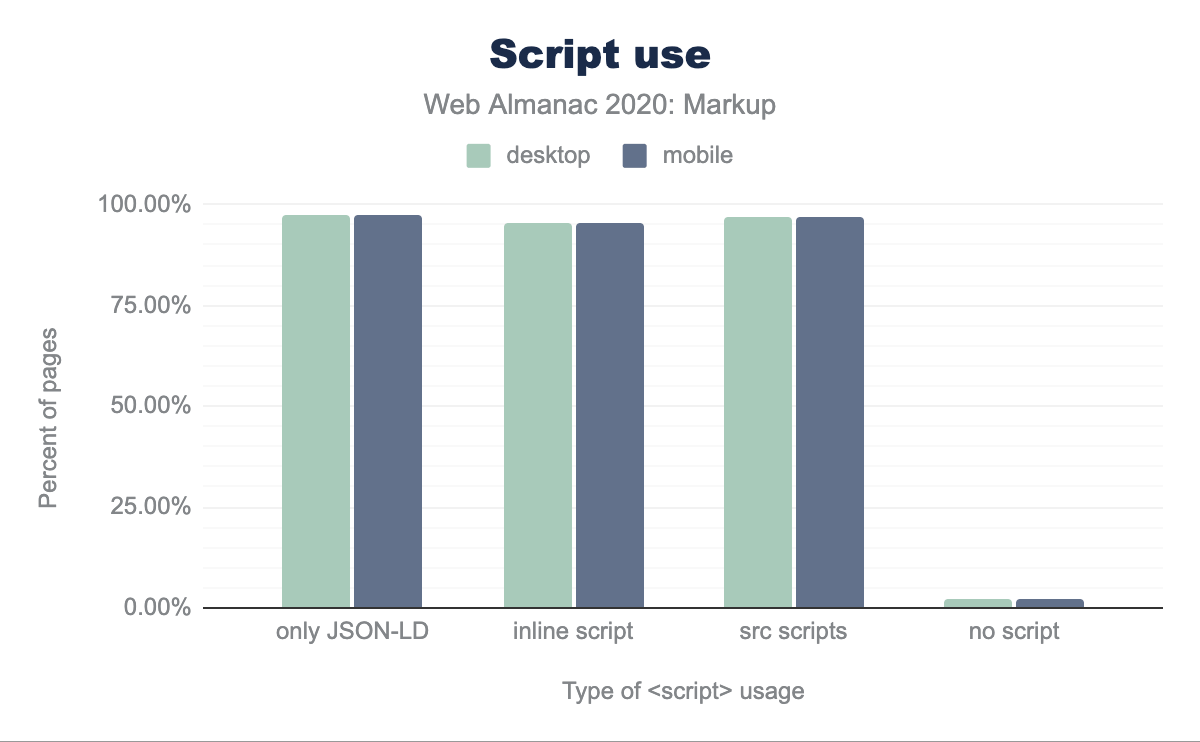
As shown in the Top elements section below, the script element is the 6th most frequently used HTML element. For the purposes of this chapter, we were interested in the ways the script element is used across these millions of pages from the data set.
Overall, around 2% of pages contain no scripting at all, not even structured data scripts with the type="application/ld+json" attribute. Considering that nowadays it’s pretty common for a page to include at least one script for an analytics solution, this seems noteworthy.
At the opposite end of the spectrum, the numbers show that about 97% of pages contain at least one script, either inline or external.
script element.
When scripting is unsupported or turned off in the browser, the noscript element helps to add an HTML section within a page. Considering the above script numbers, we were curious about the noscript element as well.
Following the analysis, we found that about 49% of pages are using a noscript element. At the same time, about 16% of noscript elements contain an iframe with a src value referring to “googletagmanager.com”.
This seems to confirm the theory that the total number of noscript elements in the wild may be affected by common scripts like Google Tag Manager which enforce users to add a noscript snippet after the body start tag on a page.
Script types
What type attribute values are used with script elements?
text/javascript: 60.03%application/ld+json: 1.68%application/json: 0.41%text/template: 0.41%text/html: 0.27%
When it comes to loading JavaScript module scripts using type="module", we found that 0.13% of script elements currently specify this attribute-value combination. nomodule is used by 0.95% of all tested pages. (Note that one metric relates to elements, the other to pages.)
36.38% of all scripts have no type values set whatsoever.
Elements
In this section, the focus is on elements: what elements are used, how frequently, which elements are likely to appear on a given page, and how the situation is with respect to custom, obsolete, and proprietary elements. Is divitis still a thing? Yes.
Element diversity
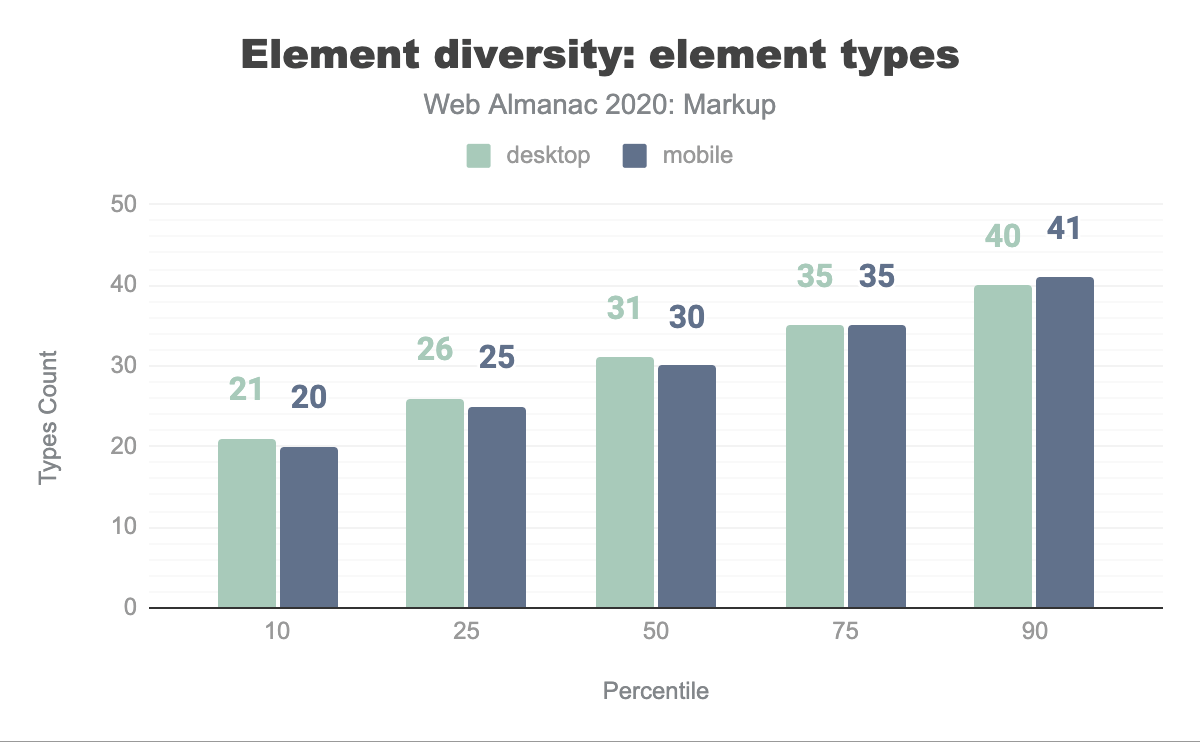
Let’s have a look at how diverse use of HTML actually is: Do authors use many different elements, or are we looking at a landscape that makes use of relatively few elements?
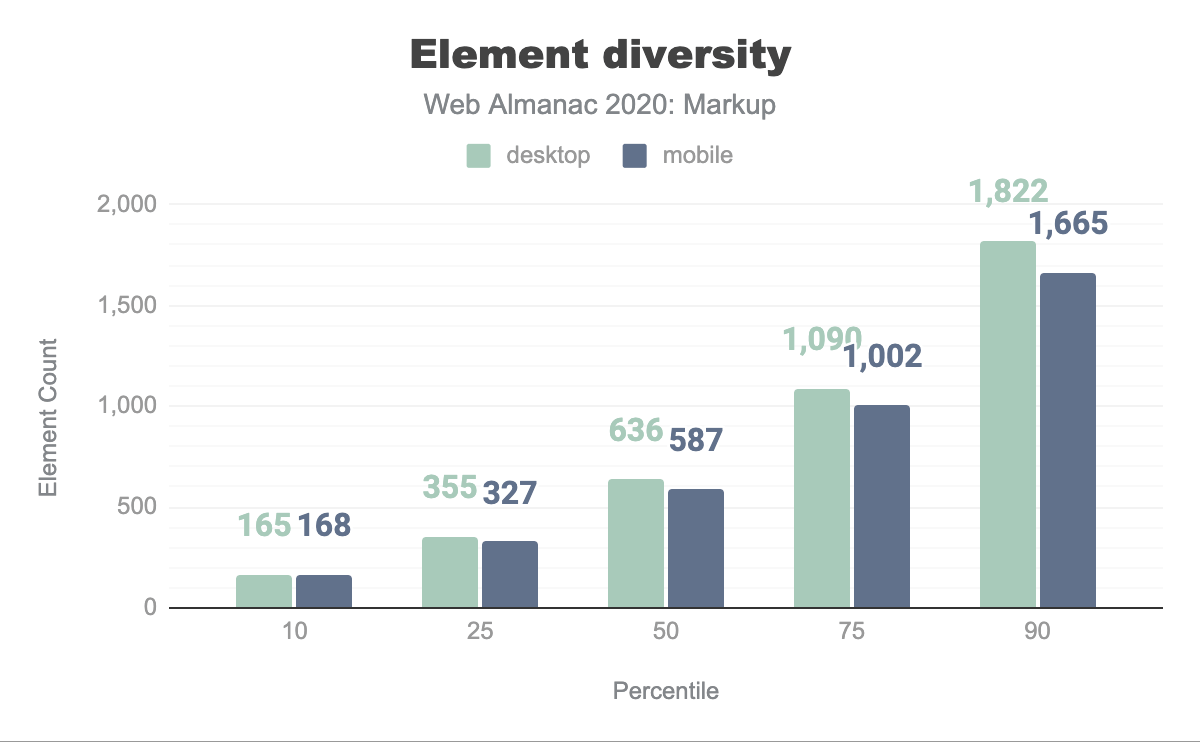
The median web page, it turns out, uses 30 different elements, 587 times:
Given that living HTML currently has 112 elements, the 90th percentile not using more than 41 elements may suggest that HTML is not nearly being exhausted by most documents. Yet it’s hard to interpret what this really means for HTML and our use of it, as the semantic wealth that HTML offers doesn’t mean that every document would need all of it: HTML elements should be used per purpose (semantics), not per availability.
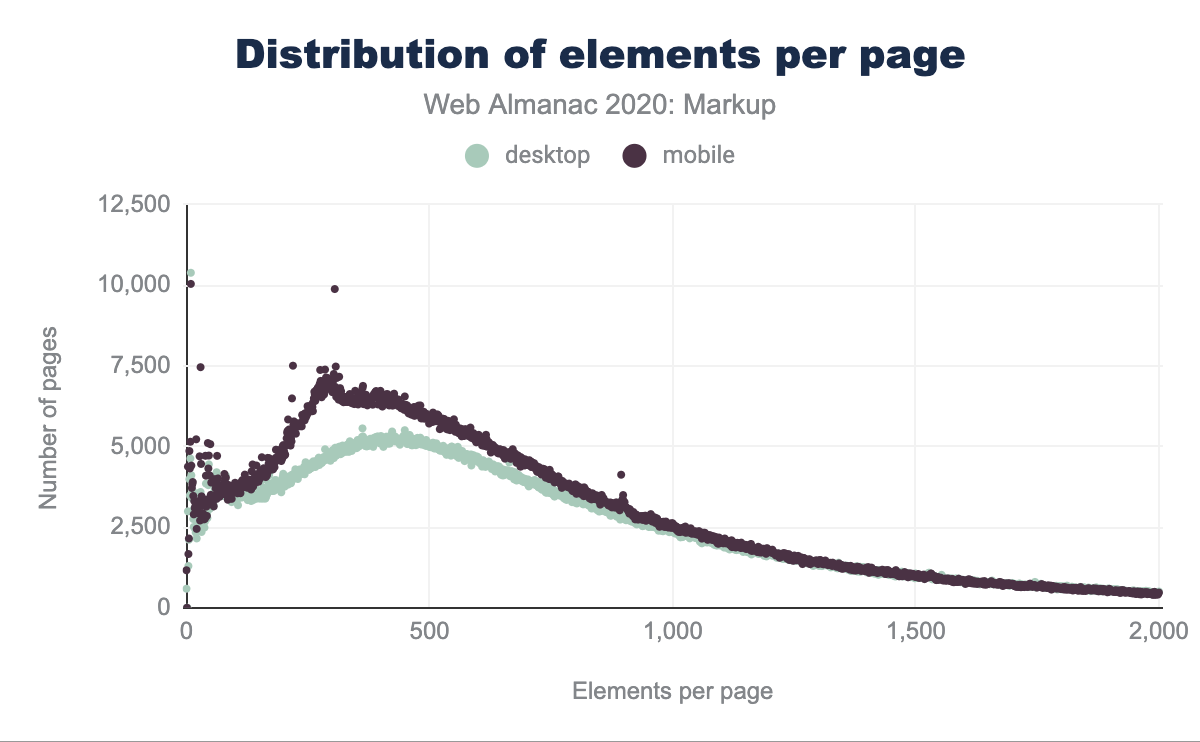
How are these elements distributed?
Not that much changed compared to 2019!
Top elements
In 2019, the Markup chapter of the Web Almanac featured the most frequently used elements in reference to Ian Hickson’s work in 2005. We found this useful and had a look at that data again:
| 2005 | 2019 | 2020 |
|---|---|---|
title |
div |
div |
a |
a |
a |
img |
span |
span |
meta |
li |
li |
br |
img |
img |
table |
script |
script |
td |
p |
p |
tr |
option |
link |
i |
||
option |
Nothing changed in the Top 7, but the option element went a little out of favor and dropped from 8 to 10, letting both the link and the i element pass in popularity. These elements have risen in use, possibly due to an increase in use of resource hints (as with prerendering and prefetching), as well icon solutions like Font Awesome, which de facto misuses i elements for the purpose of displaying icons.
details and summary
Another thing we were curious about was the use of the details and summary elements, especially since 2020 brought broad support. Are they being used? Are they attractive for—even popular—among authors? As it turns out, only 0.39% of all tested pages are using them—although it’s hard to gauge whether they were all used the correct way in exactly the situations when you need them—”popular” is the wrong word.
Here’s a simple example showing the use of a summary in a details element:
<details>
  <summary>Status: Operational</summary>
  <p>Velocity: 12m/s</p>
  <p>Direction: North</p>
</details>
A while ago, Steve Faulkner pointed out how these two elements were used inadequately in the wild. As you can tell from the example above, for each details element you’d need a summary element that may only be used as the first child of details.
Accordingly, we looked at the number of details and summary elements and it seems that they do continue to be misused. The count of summary elements is higher on both mobile and desktop, with a ratio of 1.11 summary elements for every details element on mobile, and 1.19 on desktop, respectively:
| Occurrences | ||
|---|---|---|
| Element | Mobile (0.39%) | Desktop (0.22%) |
summary |
62,992 | 43,936 |
details |
56,60 | 36,743 |
details and summary elements.
Probability of element use
Taking another look at element popularity, how likely is it to find a certain element in the DOM of a page? Sure, html, head, body are present on every HTML page (even though these tags are all optional), making them common elements, but what other elements are to be commonly found?
| Element | Probability |
|---|---|
title |
99.34% |
meta |
99.00% |
div |
98.42% |
a |
98.32% |
link |
97.79% |
script |
97.73% |
img |
95.83% |
span |
93.98% |
p |
88.71% |
ul |
87.68% |
Standard elements are those that are or were part of the HTML specification. Which ones are rare to find? In our sample, that would bring up the following:
| Element | Probability |
|---|---|
dir |
0.0082% |
rp |
0.0087% |
basefont |
0.0092% |
We’re including these elements to give an idea what elements may have gone out of favor. But while dir and basefont were last specified in XHTML 1.0 (2000) and are no longer part of HTML, the rare use of rp (which was mentioned as early as 1998 and is still part of HTML), may just suggest that ruby markup is not very popular.
Custom elements
The 2019 edition of the Web Almanac handled custom elements by discussing several non-standard elements. This year, we found it valuable to have a closer look at custom elements. How did we determine these? Roughly by looking at their definition, notably their use of a hyphen. Let’s focus on the top elements, in this case elements used on ≥1% of all URLs in the sample:
| Element | Pages | Pages (%) |
|---|---|---|
ym-measure |
141,156 | 2.22% |
wix-image |
76,969 | 1.21% |
rs-module-wrap |
71,272 | 1.12% |
rs-module |
71,271 | 1.12% |
rs-slide |
70,970 | 1.12% |
rs-slides |
70,993 | 1.12% |
rs-sbg-px |
70,414 | 1.11% |
rs-sbg-wrap |
70,414 | 1.11% |
rs-sbg |
70,413 | 1.11% |
rs-progress |
70,651 | 1.11% |
rs-mask-wrap |
63,871 | 1.01% |
rs-loop-wrap |
63,870 | 1.01% |
rs-layer-wrap |
63,849 | 1.01% |
wix-iframe |
63,590 | 1% |
These elements come from three sources: Yandex Metrica (ym-), an analytics solution we also saw last year; Slider Revolution (rs-), a WordPress slider, for which there are more elements to be found near the top of the sample; and Wix (wix-), a website builder.
Other groups that stand out include AMP markup with amp- elements like amp-img (11,700 pages), amp-analytics (10,256), and amp-auto-ads (7,621), as well as Angular app- elements like app-root (16,314), app-footer (6,745), and app-header (5,274).
Obsolete elements
There are more questions to ask about the use of HTML, including the use of obsolete elements (which are elements like applet, bgsound, blink, center, font, frame, isindex, marquee, or spacer).
In our mobile dataset of 6.3 million pages, around 0.9 million pages (14.01%) contain one or more of these elements. Here are the top 9, which are used more than 10,000 times:
| Element | Pages | Pages (%) |
|---|---|---|
center |
458,402 | 7.22% |
font |
430,987 | 6.79% |
marquee |
67,781 | 1.07% |
nobr |
31,138 | 0.49% |
big |
27,578 | 0.43% |
frame |
19,363 | 0.31% |
frameset |
19,163 | 0.30% |
strike |
17,438 | 0.27% |
noframes |
15,016 | 0.24% |
Even spacer is still being used 1,584 times, and present on every 5,000th page. We know that Google has been using a center element on their home page for 22 years now, but why are there so many imitators?
isindex
If you were wondering: The total number of isindex elements in this dataset is: one. Exactly one page used an isindex element. isindex was part of the specs until HTML 4.01 and XHTML 1.0, yet only properly specified in 2006 (aligning with how it was implemented in browsers), and then removed in 2016.
Proprietary and made-up elements
In our set of elements we found some that were neither standard HTML (nor SVG nor MathML) elements, nor custom ones, nor obsolete ones, but somewhat proprietary ones. The top 10 that we identified are the following:
| Element | Pages (%) |
|---|---|
noindex |
0.89% |
jdiv |
0.85% |
mediaelementwrapper |
0.49% |
ymaps |
0.26% |
yatag |
0.20% |
ss |
0.11% |
include |
0.08% |
olark |
0.07% |
h7 |
0.06% |
limespot |
0.05% |
The source of these elements appears to be mixed, as in some are unknown while others can be traced. The most popular one, noindex, is probably due to Yandex’s recommendation of it to prohibit page indexing. jdiv was noted in last year’s Web Almanac and is from JivoChat. mediaelementwrapper comes from the MediaElement media player. Both ymaps and yatag are also from Yandex. The ss element could be from ProStores, a former ecommerce product from eBay, and olark may be from the Olark chat software. h7 appears to be a mistake. limespot is probably related to the Limespot personalization program for ecommerce. None of these elements are part of a web standard.
Headings
Headings make for a special category of elements that play an important role in sectioning and for accessibility.
| Heading | Occurrences | Average per page |
|---|---|---|
h1 |
10,524,810 | 1.66 |
h2 |
37,312,338 | 5.88 |
h3 |
44,135,313 | 6.96 |
h4 |
20,473,598 | 3.23 |
h5 |
8,594,500 | 1.36 |
h6 |
3,527,470 | 0.56 |
You might have expected to only see the standard <h1> to <h6> elements, but some sites actually use more levels:
| Heading | Occurrences | Average per page |
|---|---|---|
h7 |
30,073 | 0.005 |
h8 |
9,266 | 0.0015 |
The last two have never been part of HTML, of course, and should not be used.
Attributes
This section focuses on how attributes are used in documents and explores patterns in data-* usage. Our findings show that class is the queen of all attributes.
Top attributes
Similar to the section on the most popular elements, this section delves into the most popular attributes on the web. Given how important the href attribute is for the web itself, or the alt attribute in order to make information accessible, would these be most popular attributes?
| Attribute | Occurrences | Percentage |
|---|---|---|
class |
2,998,695,114 | 34.23% |
href |
928,704,735 | 10.60% |
style |
523,148,251 | 5.97% |
id |
452,110,137 | 5.16% |
src |
341,604,471 | 3.90% |
type |
282,298,754 | 3.22% |
title |
231,960,356 | 2.65% |
alt |
172,668,703 | 1.97% |
rel |
171,802,460 | 1.96% |
value |
140,666,779 | 1.61% |
The most popular attribute is class, with nearly 3 billion occurrences in our dataset and constituting 34% of all attributes in use.
The value attribute, which specifies the value of an input element, surprisingly completes the top 10. It’s surprising to us because, subjectively, we didn’t get the impression value attributes were used that frequently.
Attributes on pages
Are there attributes that we find in every document? Not quite, but almost:
| Element | Pages (%) |
|---|---|
| href | 99.21% |
| src | 99.18% |
| content | 98.88% |
| name | 98.61% |
| type | 98.55% |
| class | 98.24% |
| rel | 97.98% |
| id | 97.46% |
| style | 95.95% |
| alt | 90.75% |
These results raise questions that we cannot answer. For example, type is used on other elements, too, but why this tremendous popularity? Especially given that it’s usually not needed to specify for style sheets or scripts, with CSS and JavaScript being assumed default. Or, how do we really fare with alt? Do those 9.25% of pages not contain any images or are they just inaccessible?
data-* attributes
Per the HTML spec, data-* attributes “are intended to store custom data, state, annotations, and similar, private to the page or application, for which there are no more appropriate attributes or elements.” How are they used? What are the popular ones? Is there anything interesting here?
The two most popular ones stand out because they are almost twice as popular than each of the attributes that followed (with >1% use):
| Attribute | Occurrences | Percentage |
|---|---|---|
data-src |
26,734,560 | 3.30% |
data-id |
26,596,769 | 3.28% |
data-toggle |
12,198,883 | 1.50% |
data-slick-index |
11,775,250 | 1.45% |
data-element_type |
11,263,176 | 1.39% |
data-type |
11,130,662 | 1.37% |
data-requiremodule |
8,303,675 | 1.02% |
data-requirecontext |
8,302,335 | 1.02% |
data-* attributes.
Attributes like data-type, data-id, and data-src can have multiple generic uses although data-src is used a lot with lazy image loading via JavaScript (e.g., Bootstrap 4). Bootstrap again explains the presence of data-toggle, where it’s used as a state styling hook on toggle buttons. The Slick carousel plugin is the source of data-slick-index, whereas data-element_type is part of Elementor’s WordPress website builder. Both data-requiremodule and data-requirecontext, then, are part of RequireJS.
Interestingly, the use of native lazy loading on images is similar to that of data-src. 3.86% of pages use loading="lazy" on <img> elements. This appears to be growing very fast, as back in February, this number was about 0.8%. It’s possible that these are being used together for a cross-browser solution.
Miscellaneous
We’ve covered the use of HTML in general as well as the adoption of top elements and attributes. In this section, we’re reviewing some of the special cases of viewports, favicons, buttons, inputs, and links. One thing we note here is that too many links still point to “http” URLs.
viewport specifications
The viewport meta element is used to control layout on mobile browsers. While years ago, the motto was kind of “don’t forget the viewport meta element” when building a web page, eventually this became a common practice and the motto changed to “make sure zooming and scaling are not disabled.”
Users should be able to zoom and scale the text up to 500%. That’s why audits in popular tools like Lighthouse or axe fail when user-scalable="no" is used within the meta name="viewport" element, and when the maximum-scale attribute value is less than 5.
We had a look at the data and in order to better understand the results, we normalized it by removing spaces, converting everything to lowercase, and sorting by comma values of the content attribute.
| Content attribute value | Pages | Pages (%) |
|---|---|---|
initial-scale=1,width=device-width |
2,728,491 | 42.98% |
| blank | 688,293 | 10,84% |
initial-scale=1,maximum-scale=1,width=device-width |
373,136 | 5.88% |
initial-scale=1,maximum-scale=1,user-scalable=no,width=device-width |
352,972 | 5.56% |
initial-scale=1,maximum-scale=1,user-scalable=0,width=device-width |
249,662 | 3.93% |
width=device-width |
231,668 | 3.65% |
viewport specifications, and lack thereof.
The results show that almost half of the pages we analyzed are using the typical viewport content value. Still, around 10% of mobile pages are entirely missing a proper content value for the viewport meta element, with the rest of them using an improper combination of maximum-scale, minimum-scale, user-scalable=no, or user-scalable=0.
Favicons
The situation around favicons is fascinating. Favicons work with or without markup (some browsers would fall back to looking at the domain root), accept several image formats, and then also promote several dozen sizes (some tools are reported to generate 45 of them; realfavicongenerator.net would return 37 if requested to handle every case). As of this time of writing, there is an open issue for the HTML spec to help improve the situation.
When we built our tests we didn’t check for the presence of images, but only looked at the markup. That means, when you review the following, note that it’s more about how favicons are referenced rather than whether or how often they are used.
| Favicon format | Pages | Pages (%) |
|---|---|---|
| ICO | 2,245,646 | 35.38% |
| PNG | 1,966,530 | 30.98% |
| No favicon defined | 1,643,136 | 25.88% |
| JPG | 319,935 | 5.04% |
| No extension specified (no format identifiable) | 37,011 | 0.58% |
| GIF | 34,559 | 0.54% |
| WebP | 10,605 | 0.17% |
| … | ||
| SVG | 5,328 | 0.08% |
There are a couple of surprises in here:
- Support for other formats is there but ICO is still the go-to format for favicons on the web.
- JPG is a relatively popular favicon format even though it may not yield the best results (or a comparatively large weight) for many favicon sizes.
- WebP is twice as popular as SVG! This might change, however, with SVG favicon support improving.
Button and input types
There has been a lot of discussion on buttons lately and how often they are misused. We looked into this to present findings on some of the native HTML buttons.
| Button types | Occurrences | Pages (%) |
|---|---|---|
<button type="button"> |
15,926,061 | 36.41% |
<button> without type |
11,838,110 | 32.43% |
<button type="submit"> |
4,842,946 | 28.55% |
<input type="submit" value="…"> |
4,000,844 | 31.82% |
<input type="button" value="…"> |
1,087,182 | 4.07% |
<input type="image" src="…"> |
322,855 | 2.69% |
<button type="reset"> |
41,735 | 0.49% |
Our analysis shows that about 60% of pages contain a button element and more than half of those pages (32.43%) have at least one button that fails to specify a type attribute. Note that the button element has a default type of submit, so the default behavior of buttons on these 32% of pages is to submit the current form data. To avoid possibly unexpected behavior like this, a best practice is to specify the type attribute.
| Percentile | Buttons per page |
|---|---|
| 10 | 0 |
| 25 | 0 |
| 50 | 1 |
| 75 | 5 |
| 90 | 13 |
Pages in the 10th and 25th percentiles contain no buttons at all, while a page in the 90th percentile contains 13 native button elements. In other words, 10% of pages contain 13 or more buttons.
Link targets
The anchor element, or a element, links web resources together. In this section, we analyze the adoption of the protocols included in the respective link targets.
| Protocol | Occurrences | Pages (%) |
|---|---|---|
https |
5,756,444 | 90.69% |
http |
4,089,769 | 64.43% |
mailto |
1,691,220 | 26.64% |
javascript |
1,583,814 | 24.95% |
tel |
1,335,919 | 21.05% |
whatsapp |
34,643 | 0.55% |
viber |
25,951 | 0.41% |
skype |
22,378 | 0.35% |
sms |
17,304 | 0.27% |
intent |
12,807 | 0.20% |
We can see how https and http are most dominant, followed by “benign” links to make writing email, making phone calls, and sending messages easier. javascript stands out as a link target that’s still very popular even though JavaScript offers native and gracefully degrading options to work with.
Links in new windows
noopener nor noreferrer attributes on target="_blank" links.
Using target="_blank" has been known to be a security vulnerability for some time now. Yet 71.35% of pages contain links with target="_blank", without noopener or noreferrer.
| Elements | Pages |
|---|---|
<a target="_blank" rel="noopener noreferrer"> |
13.63% |
<a target="_blank" rel="noopener"> |
14.14% |
<a target="_blank" rel="noreferrer"> |
0.56% |
As a rule of thumb and for usability reasons, it is recommended not to use target="_blank" in the first place.
Conclusion
We’ve touched on some observations throughout the chapter, but as a reflection on the state of markup in 2020, here are some things that stood out for us:
Fewer pages land in quirks mode. In 2016, that number was at around 7.4%. At the end of 2019, we observed 4.85%. And now, we’re at about 3.97%. This trend, to paraphrase Simon Pieters in his review of this chapter, seems clear and encouraging.
Although we lack historic data to draw the full development picture, “meaningless” div, span, and i markup has pretty much replaced the table markup we’ve observed in the 1990s and early 2000s. While one may question whether div and span elements are always used without there being a semantically more appropriate alternative, these elements are still preferable to table markup, though, as during the heyday of the old web, these were seemingly used for everything but tabular data.
Elements per page and element types per page stayed roughly the same, showing no significant change in our HTML writing practice when compared to 2019. Such changes may require more time to manifest.
Proprietary product-specific elements like g:plusone (used on 17,607 pages in the mobile sample) and fb:like (11,335) have almost disappeared after still being among the most popular ones last year. However, we observe more custom elements for things like Slider Revolution, AMP, and Angular. Elements like ym-measure, jdiv, and ymaps are also still prevalent. What we imagine we’re seeing here is that, under the sea of slowly changing practices, HTML is very much being developed and maintained, as authors toss deprecated markup and embrace new solutions.
Now, the 2019 Web Almanac Markup chapter had 14 years of catch up to do since the last major study on the topic, so you’d think we wouldn’t have much to cover in the year since. Yet what we observe with this year’s data is that there’s a lot of movement at the bottom and near the shore of said sea of HTML. We approach near-complete adoption of living HTML. We are quick to prune our pages of fads like Google and Facebook widgets. We’re also fast in adopting and shunning frameworks, as both Angular and AMP (though a “component framework”) seem to have significantly lost in popularity, likely for solutions like React and Vue.
And still, there are no signs we exhausted the options HTML gives us. The median of 30 different elements used on a given page, which is roughly a quarter of the elements HTML provides us with, suggests a rather one-sided use of HTML. That is supported by the immense popularity of elements like div and span, and no custom elements to potentially meet the demands that these two elements may represent. Unfortunately, we couldn’t validate each document in the sample; however, anecdotally and to be taken with caution, we learned that 79% of W3C-tested documents have validation errors. After everything we’ve seen, it looks like we’re still far from mastering the craft of HTML.
That compels us to close with an appeal: Pay attention to HTML. Focus on HTML. It’s important and worthwhile to invest in HTML. HTML is a document language that may not have the charm of a programming language, and yet the web is built on it. Use less HTML and learn what’s really needed. Use more appropriate HTML—learn what’s available and what it’s there for. And validate your HTML. Anyone can write invalid HTML (just invite the next person you meet to write an HTML document and validate the output) but a professional developer can be expected to produce valid HTML. Writing correct and valid HTML is a craft to take pride in.
For the next edition of the Web Almanac’s chapter, let’s prepare to look closer at the craft of writing HTML and, hopefully, how we’ve been improving on it.
